Amtrak’s Routes: By The Numbers
A New Era
For the first time in a long, long time passenger rail in the US has not only growth, but strong, sustained growth. As Amtrak resumed service on all routes suspended during the pandemic; national ridership showed an overall 24.6% increase compared to the prior year. That means a $130 million increase in operating earnings, with an overall operating revenue of $3.4 billion in the past year. Along with the $16.4 billion coming from the US Bipartisan Infrastructure Law; these earnings are huge in alleviating the significant cost increases brought on by the pandemic. Furthermore, these extra funds will be key to supporting Amtrak’s infrastructure investment program. In this past year alone, Amtrak made its largest annual capital investment in company history. This came in the form of a nearly $3 billion investment into modern rolling stock, enhanced station facilities, new rail infrastructure (tunnels/bridges), as well as welcoming more than 4,800 new workers onboard to facilitate and sustain what Amtrak is calling a “new era” of passenger rail.
Though Amtrak’s investments span their entire system; the accomplishments made to expand, enhance, and restore route service this past year has been one of most important. After slowly crawling out of a pandemic of mounting costs, shuttered stations, and low ridership; in September 2023, overall Amtrak ridership finally reached pre-pandemic levels. These numbers coming as ridership on state supported routes "grew nearly 23%, serving more than 12.5 million customer trips between October 2022 and September 2023,” according to Amtrak’s fiscal year data.
The Northeast Regional Routes
Nowhere can this increase in ridership be seen more than in the Northeast. Considerable ridership increases were posted across all services offered by Amtrak in the region. Specifically, the ‘Downeaster’ route in Maine recorded both monthly and annual all-time highs. In addition to record ridership; Amtrak’s Montrèal to New York City, ‘Adirondack’ service resumed for the first time since 2020 via a collaboration between Canada’s VIA Rail and the New York’s Department of Transportation. Overall, the Northeast’s regional, state supported ridership surpassed pre-pandemic levels, with a 29% increase compared to the year prior. Consequently of adding nearly 3 million passengers, according to Amtrak, This year, “...we introduced red ultra-low, more affordable ’Night Owl’ fares with one-way travel between $5-$20 on select routes in Washington DC and New York City.”
Northeast Routes Amtrak Services: By The Numbers (ridership data FY 2023)
Acela “high-speed rail’ ~ Boston, MA > New Haven, CT > NYC > Wilmington, DE > Washington DC = 7h
2,959,384 passengers, 38% increase from 2022
Empire ~ NYC > Albany, NY > Syracuse, NY > Rochester, NY > Buffalo, NY > Niagara Falls = 7h20m
1,244,276 passengers, 22% increase from 2022
Keystone ~ NYC > Philadelphia, PA > Harrisburg, PA = 3h50m
1,115,779 passengers, 38.4% increase from 2022
Downeaster ~ North Station-Boston, MA > Dover, NH > Portland, ME > Brunswick, ME = 3h25m
542,639 passengers, 22% increase from 2022
Maple Leaf ~ Toronto, ON > Niagara Falls > Syracuse, NY > Albany, NY > NYC = 12h30m
452,711 passengers, 17.6% increase from 2022
New Haven-Springfield ~ New Haven, CT > Hartford, CT > Springfield, MA = 1h24m
442,028 passengers, 36.3% increase from 2022
Pennsylvanian ~ NYC > Philadephia, PA > Harrisburg, PA > Pittsburgh, PA = 9h20m
192,728 passenger, 9.4% increase from 2022
Vermonter ~ Washington DC > Burlington, VT > NYC > St. Albans, VT = 13h45m
99,974 passenger, 14.5% increase from 2022
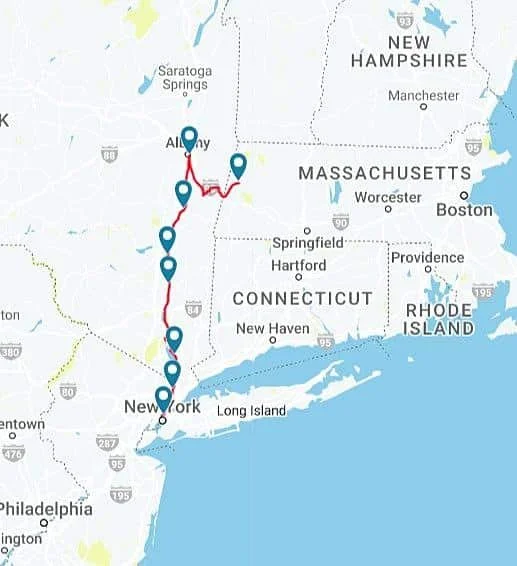
Ethan Allen ~ Burlington, VT > Rutland, VT > Albany, NY > NYC = 4h34m
86,638 passengers, 36.7% increase from 2022
Adirondack ~ Montrèal, QC > Albany, NY > NYC = 10h
26,892 passengers, resumed operation
Berkshire Flyer ~ NYC > Poughkeepsie, NY > Albany, NY > Pittsfield, MA = 4h5m
1,210 passengers, 47.7% increase from 2022
…by Overall Service Ridership +/-
Berkshire Flyer (NYC-Pittsfield, MA) ~ +47.7%
Keystone (NYC-Harrisburg, PA) ~ +38.8%
Acela (Boston-Washington DC) ~ +38%
Ethan Allen (Burlington, VT-NYC) ~ +36.7%
New Haven-Springfield (New Haven, CT-Springfield, MA) ~ +36.3%
Empire (NYC-Niagra Falls) ~ +22%
Downeaster (Boston-Brunswick, ME) ~ +22%
Maple Leaf (Toronto-NYC) ~ +17.9%
Pennsylvanian (NYC-Pittsburgh) ~ +9.4%
Adirondack (Montrèal-NYC) ~ resumed service
Looking at the region’s services in order by ridership increase; you can really tell the importance of New York City in a lot of these routes.
In addition to the regional services are Amtrak’s “high-speed” ‘Acela’ service; which increased passengers by by 38% compared to 2022. This nearly three million rider increase can be contributed to the expanded weekend service; including additional roundtrips between Boston and New York City on Sundays. ‘Acela’ “night-owl” deals also helped in increase ridership. In general, markets from NYC to Boston saw hours, rolling stock, and services expanded. This, in turn, improved ridership and accessibility of the rail services. Finally, more states in the region worked together to come together on service agreements. For example, more regional service was added connecting Springfield Union Station (MA), Penn Station (NYC), and other communities. This was done in collaboration between the Massachusetts' Department of Transportation (DOT), Connecticut’s DOT, and the Metropolitan Transportation Authority (MTA) Metro-North. Additionally, This past year Amtrak increased the frequency at small stops between Washington DC and NYC; also contributing to the increase in regional ridership between the two hubs.
The Midwestern Regional Routes
Though to a lesser degree, the US Midwest has seen its share of improvement this past year. Most notably in the form of faster travel times on the Chicago to St. Louis route with a new maximum speed of 110mph on Amtrak’s ‘Lincoln’ service. New state supported partnerships with Amtrak also came together this year in the region. Most notably, Amtrak collaborating in partnership with the state DOTs of Minnesota and Wisconsin to bring new regional service between the Twin Cities, Milwaukee, and Chicago set to open in early 2024. In 2024 as well, will be the reopening of Gulf Coast connections to the region via two daily roundtrips between New Orleans, LA and Mobile, AL in partnership with the Southern Rail Commission. I’m hoping Indiana and Ohio begin state-supported services in the near future, as well
Midwestern Routes Amtrak Services: By The Numbers (ridership data FY 2023)
Hiawatha ~ Chicago > Milwaukee, WI = 1h29m
636,854 passengers, 26.9% increase from 2022
Lincoln Service ~ Chicago > St. Louis, MO > Kansas City, MO = 11h45m
523,304 passengers, 9.9% increase from 2022
Wolverine ~ Chicago > Kalamazoo, MI > Ann Arbor, MI > Detroit > Pontiac, MI = 6h
420,569 passengers, 14.5% increase from 2022
Illini ~ Chicago > Champaign, IL > Carbondale, IL = 5h30m
270,017 passengers, 20.4% increase from 2022
Blue Water ~ Chicago > East Lansing, MI > Flint, MI > Port Huron, MI = 6h30m
168,848 passengers, 16.4% increase from 2022
Missouri River Runner ~ Kansas City, MO > Jefferson City, MO > St. Louis, MO = 5h30m
153,181 passengers, 27.5% increase from 2022
Illinois Zephyr ~ Chicago > Naperville, IL > Galesburg, IL > Quincy, IL = 4h30m
114,521 passengers, 14.7% decrease from 2022
Pere Marquette ~ Chicago > Benton Harbor, MI > Grand Rapids, MI = 4h
85,845 passengers, 0.4% decrease from 2022
…by Overall Service Ridership +/-
Missouri River Runner (Kansas City-St. Louis) ~ +27.5%
Hiawatha (Chicago-Milwaukee) ~ +26.9%
Illini (Chicago-Carbondale, IL) ~ +20.4%
Blue Water (Chicago-Port Huron, MI) ~ +16.4%
Wolverine (Chicago-Pontiac, MI) ~ +14.5%
Lincoln Service (Chicago-Kansas City) ~ +9.9%
Pere Marquette (Chicago-Grand Rapids, MI) ~ -0.4%
Illinois Zephyr (Chicago-Quincy, IL) ~ -14.7%
Surprisingly, Missouri’s ‘River Runner’ service had the largest increase in ridership in the region. Beating out the historically more popular Chicago to Milwaukee ‘Hiawatha’ route. In a region where passenger rail has become an afterthought in the minds of many leaders, Missouri is currently a bright spot and a state to look to when planning these future passenger lines.
The Southern Regional Routes
Just south of Northeast Corridor, record annual ridership increases were posted by both Virginia and North Carolina. Both states hosted some of the largest ridership increases in the country. In addition to Virginia’s numerous state-supported routes; North Carolina’s DOT and Amtrak struck a deal this past year. With this partnership came the addition of more roundtrip service between Charlotte and Raleigh. In the not-to-distant future, this route can possibly connect to the Northeast Corridor via Virginia. Furthermore, despite not much happening in regional rail outside of these two states; work between the other states and Amtrak is slowly happening. In the last year, most notably; the signing of a development agreement between Louisiana’s DOT and Amtrak to return intercity passenger rail services between Baton Rouge and New Orleans in the next couple years using additional funding from the region’s earnings. Elsewhere In the region, Amtrak’s ‘Heartland Flyer’ service is looking to expand the route northward to Newton, Kansas via Wichita, as well as expand from 1 to 3 daily roundtrips between Oklahoma City and Ft. Worth.
Southern Routes Amtrak Services: By The Numbers (ridership data FY 2023)
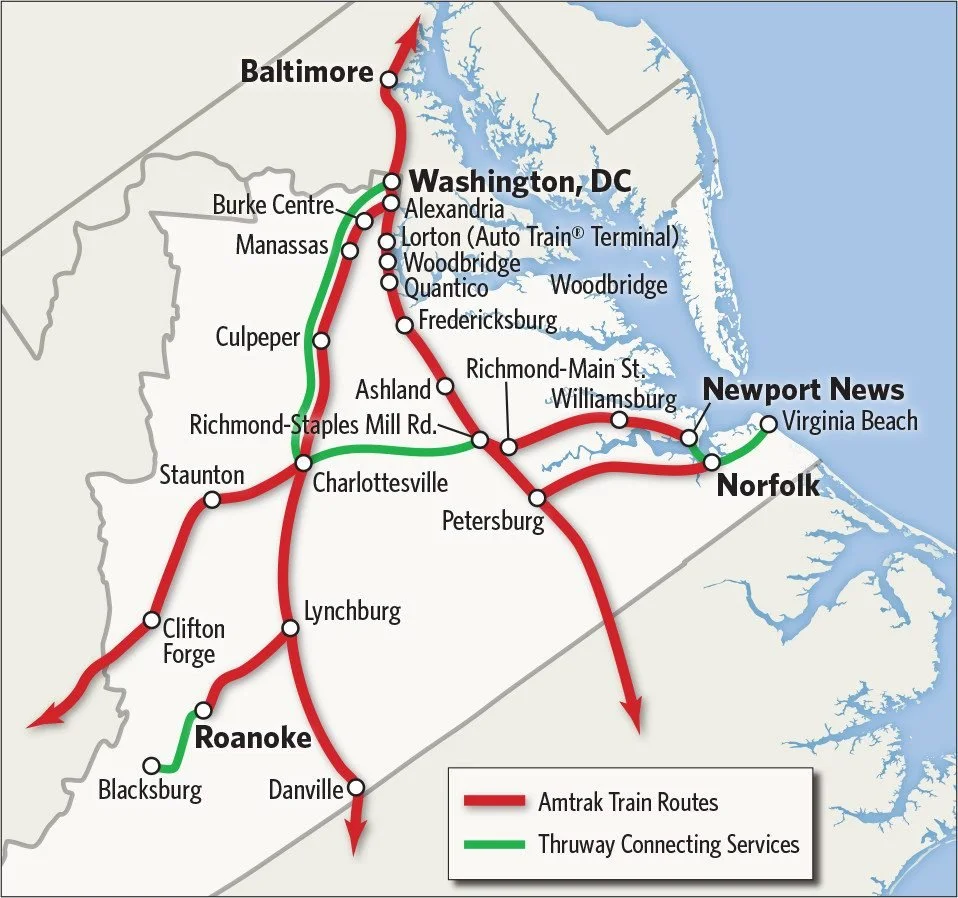
Washington-Norfolk ~ Washington DC > Petersburg, VA > Norfolk, VA = 4h40m
480,047 passengers, 54.2% increase from 2022
Washington-Newport News ~ Washington DC > Williamsburg, VA > Newport News, VA = 4h15m
356,309 passengers, 43% increase from 2022
Washington-Roanoke ~ Washington DC > Charlottesville, VA > Roanoke, VA = 4h55m
329,163 passengers, 43.1% increase from 2022
Carolinian ~ NYC > Richmond, VA > Greensboro, NC > Charlotte, NC = 14h
315,781 passengers, 16.9% increase from 2022
Piedmont ~ Raleigh, NC > Durham, NC > Greensboro, NC > Charlotte, NC = 3h
289,955 passengers, 36.4% increase from 2022
Washington-Richmond ~ Washington DC > Fredericksburg, VA > Main St-Richmond, VA = 2h40m
135,257 passengers, 45% increase from 2022
Heartland Flyer ~ Oklahoma City, OK > Fort Worth, TX = 4h
72,379 passengers, 14.8% increase from 2022
…by Overall Service Ridership +/-
Washington-Norfolk (Washington DC-Norfolk, VA) ~ +54.2%
Washington-Richmond (Washington DC-Richmond, VA) ~ +45%
Washington-Roanoke (Washington DC-Roanoke, VA) ~ +43.1%
Washington-Newport News (Washington DC-Newport News, VA) ~ +43%
Piedmont (Raleigh, NC-Charlotte, NC) ~ +36.4%
Carolinian (NYC-Charlotte, NC) ~ +16.9%
Heartland Flyer (OKC-Ft. Worth, TX) ~ +14.8%
The Western Regional Routes
The US West Coast saw Amtrak lines restored with a few records being made along the way. Most notably in the Pacific Northwest; where this past year two new daily Amtrak ‘Cascades’ trips made their debut. In collaboration with Amtrak and both the Washington and Oregon Departments of Transportation; Amtrak now runs six daily roundtrips of their “Cascades” train, along with one on their “Coast Starlight” service between Seattle and Portland. Not only that but, the “Cascades” service has now been restored so trains can be routed from Portland to Vancouver. This has doubled the number of daily roundtrips between Portland and Seattle, while also making the region overall more accessible by passenger rail. Daily round trips between the two cities increased from two to four. Consequently, passenger numbers have shot up on the “Cascades” service by 71.6% compared to the year prior. Aside from in the northwest, daily ridership records were made down south on Amtrak’s San Joaquins special train service to Allensworth State Historic Park during the 2023 Juneteenth Festival.
Western Routes Amtrak Services: By The Numbers (ridership data FY 2023)
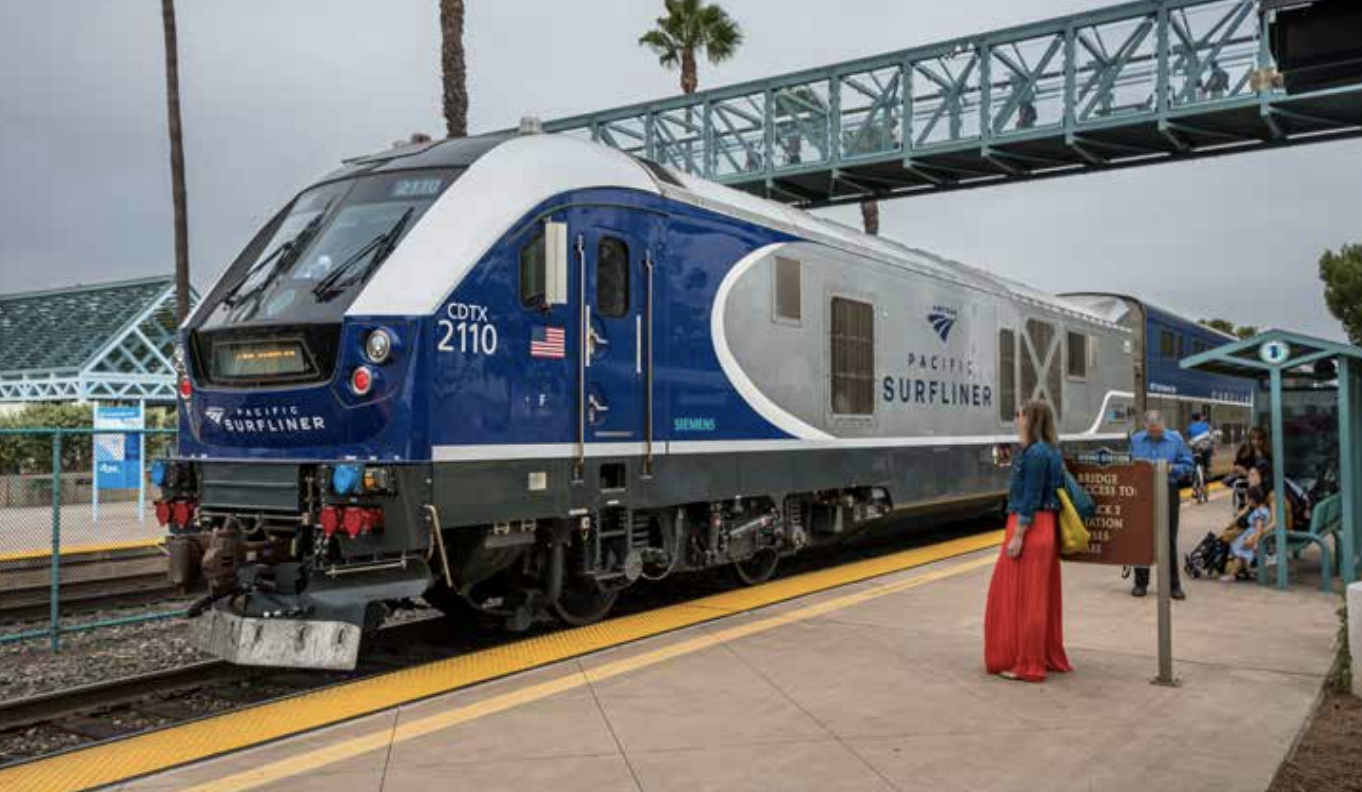
Pacific Surfliner ~ San Luis Obispo, CA > Santa Barbara, CA > LA > San Diego, CA = 5h45m
1,517,425 passengers, 7.1% decrease from 2022
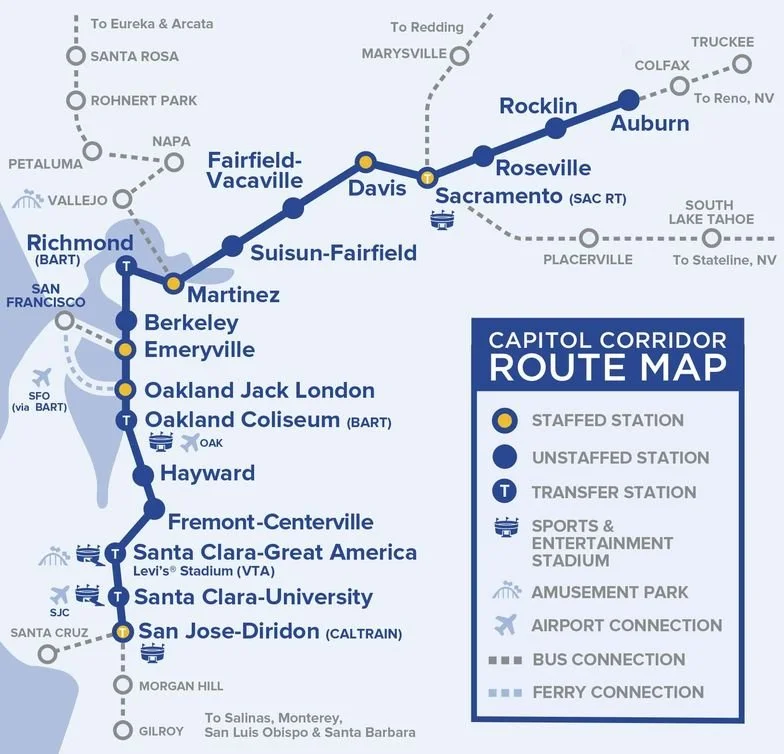
Capitol Corridor ~ Auburn, CA > Sacramento, CA > San Jose, CA = 3h15m
921,112 passengers, 36.7% increase from 2022
San Joaquins ~ San Francisco/Sacramento > Bakersfield, CA > Southern California = 6h15m
847,364 passengers, 19.3% increase from 2022
Cascades ~ Vancouver, BC > Seattle, WA > Portland, OR > Eugene, OR = 10h25m
669,820 passengers, 71.6% increase from 2022
…by Overall Service Ridership +/-
Cascades (Vancouver, BC-Eugene, OR) ~ +71.6%
Capitol Corridor (Auburn, CA-San Jose, CA) ~ +36.7%
San Joaquins (San Francisco/Sacramento-SoCal) ~ +19.3%
Pacific Surfliner (San Luis Obispo, CA-San Diego, CA) ~ -7.1%
Amtrak’s Long-Distance Routes
Finally, I decided to group Amtrak’s longer routes all together. While not focusing on the regions they reside, rather taking into consideration where the routes themselves are going. In short, asking ourselves where are passengers going? As with regional rail travel, long-distance passenger rail numbers overall increased. Compared to 2022, 2023 saw ridership grow by nearly 13%, while serving nearly 3.9 million customer trips overall. All long distance routes across the country saw pre-pandemic frequencies recover. Furthermore, Amtrak has continued it’s mission to improve the Long Distance customer experience including; deploying new rolling stock, improving food and beverage options, updating train carriage interiors, and improving the accessibility and amenities at station facilities.
Long-Distance Routes Amtrak Services: By The Numbers (ridership data FY 2023)
Silver Star ~ NYC > Washington DC > Richmond, VA > Raleigh, NC > Charlotte, NC > Savannah, GA > Tampa/Miami = 28h
351,732 passengers, 19.1% decrease from 2022
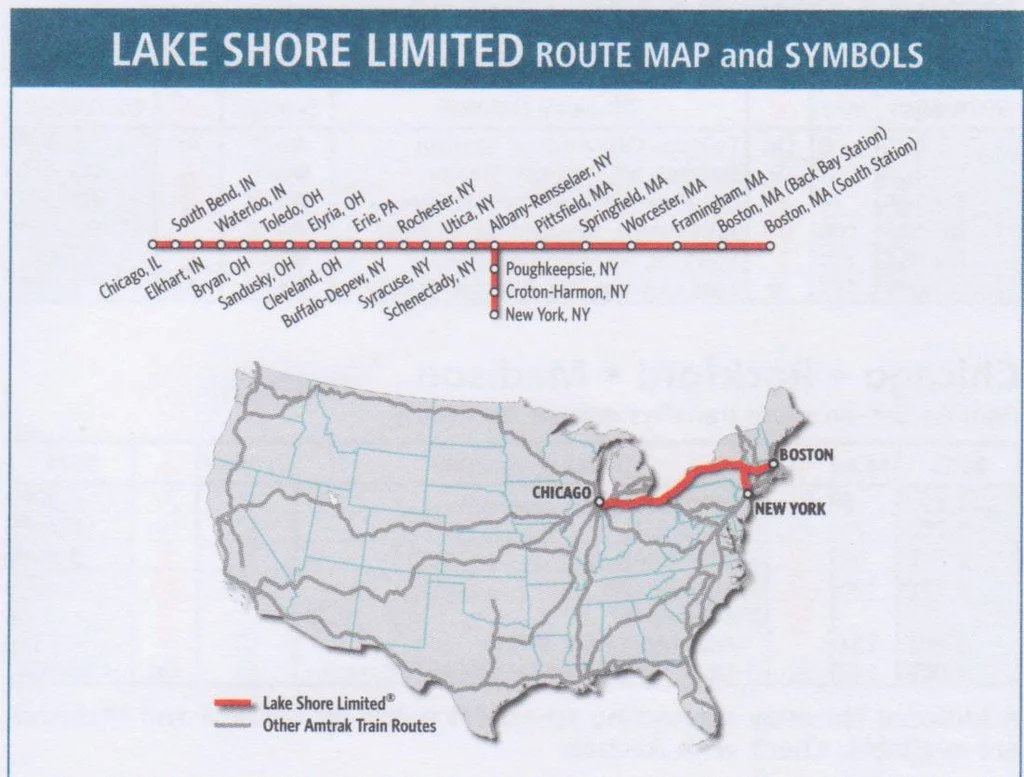
Lake Shore Limited ~ Chicago > Cleveland, OH > Albany, NY > Boston/NYC = 19h
351,049 passengers, 10% increase from 2022
Empire Builder ~ Chicago > Twin Cities > Spokane > Portland/Seattle = 46h
348,993 passengers, 15% increase from 2022
Coast Starlight ~ Seattle > Portland, OR > Sacramento, CA > LA = 35h
338,017 passengers, 4.2% decrease from 2022
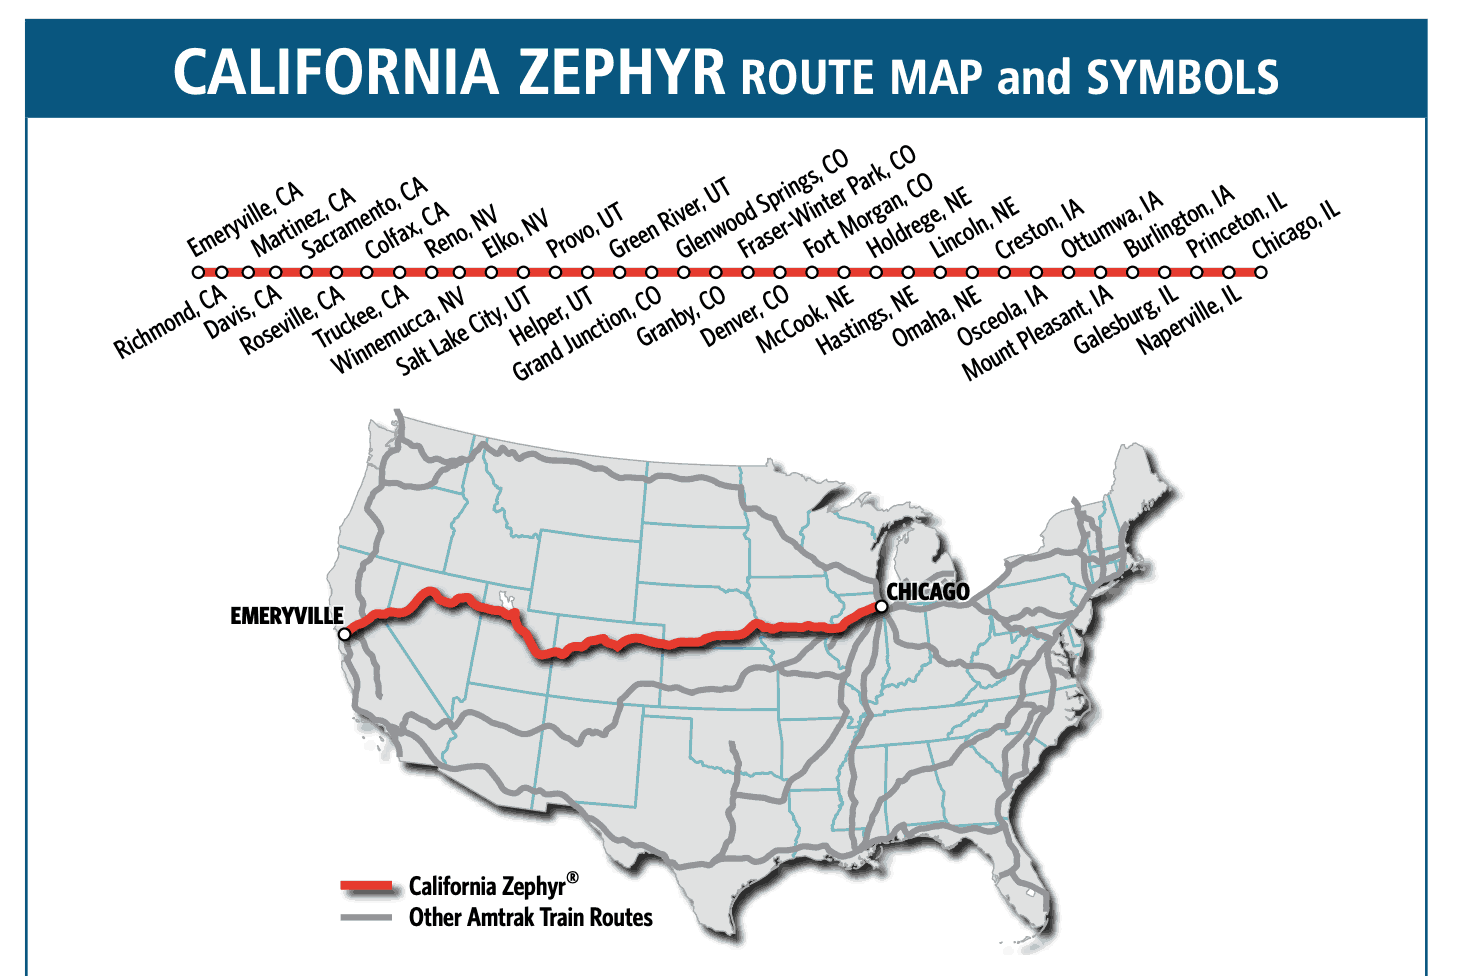
California Zephyr ~ Chicago > Omaha, NE > Denver > Salt Lake City > San Francisco = 51h20m
328,458 passengers, 13.1% increase from 2022
Palmetto ~ NYC > Washington DC > Richmond, VA > Raleigh, NC > Charlotte, NC > Savannah, GA > Tampa/Miami = 28h
318,324 passengers, 14.9% increase from 2022
Texas Eagle ~ Chicago > St. Louis > San Antonio, TX > LA = 65h20m
294,439 passengers, 16.2% increase from 2022
Silver Meteor ~ NYC > Washington DC > Richmond, VA > Raleigh, NC > Charlotte, NC > Savannah, GA > Tampa/Miami = 28h
283,932 passengers, 258.5% increase from 2022
Auto Train ~ Washington DC > Orlando, FL = 17h
283,646 passengers, 1.7% increase from 2022
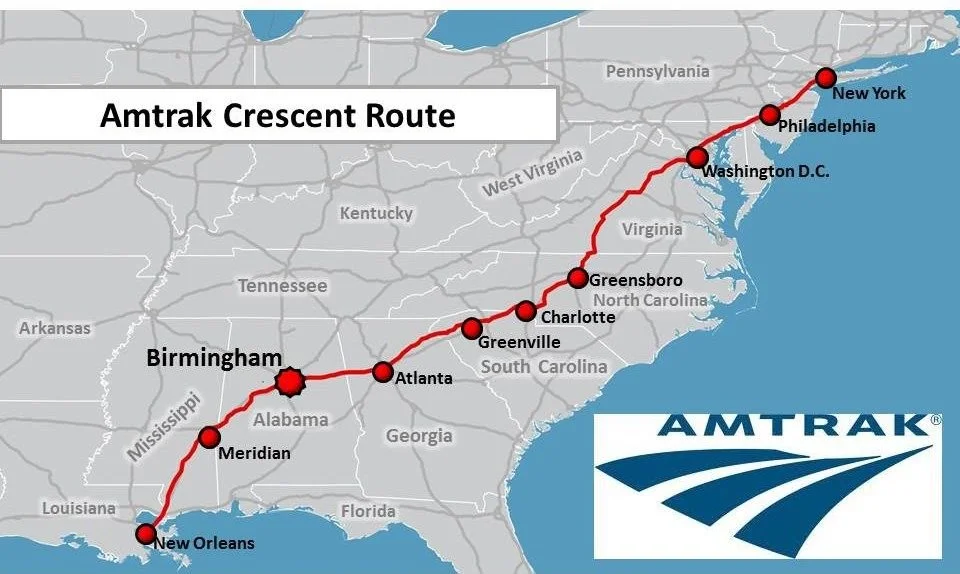
Crescent ~ NYC > Atlanta, GA > New Orleans, LA = 30h
271,518 passengers, 34% increase from 2022
Southwest Chief ~ Chicago > Kansas City, MO > Albuquerque, NM > Flagstaff, AZ > LA = 40h+
253,838 passengers, 13.5% increase from 2022
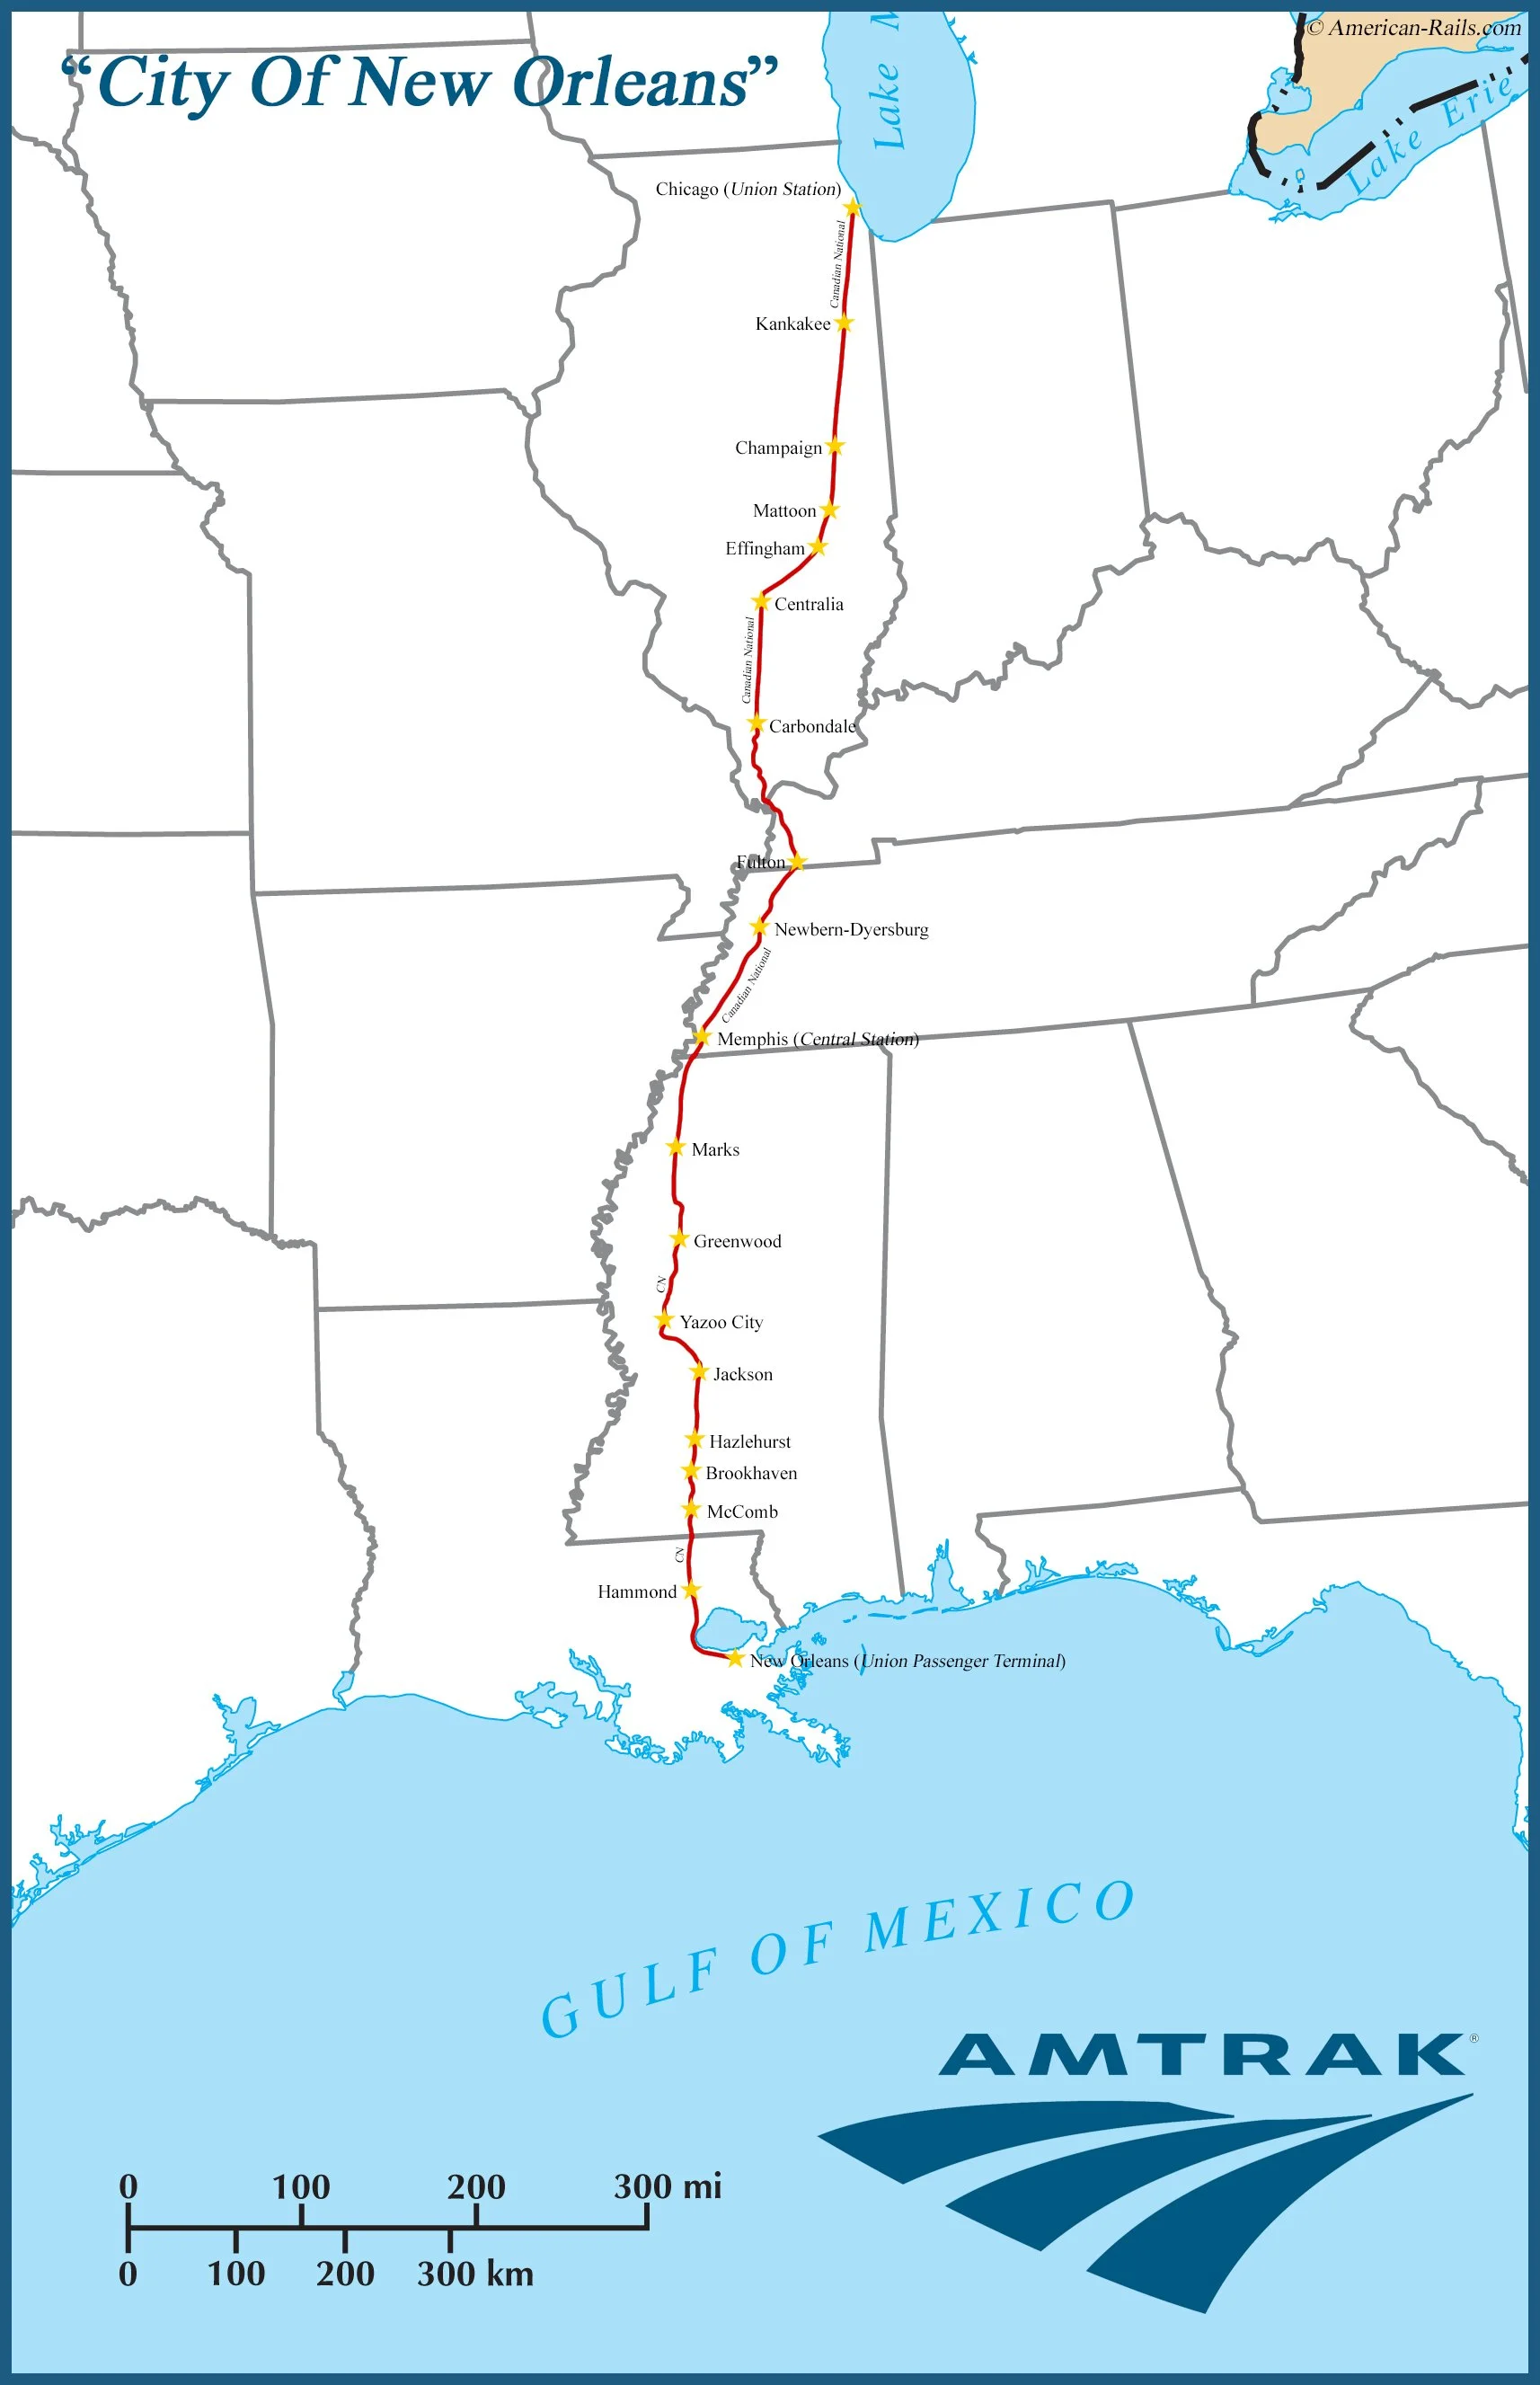
City of New Orleans ~ Chicago > Memphis, TN > New Orleans, LA = 19h
233,876 passengers, 50.3% increase from 2022
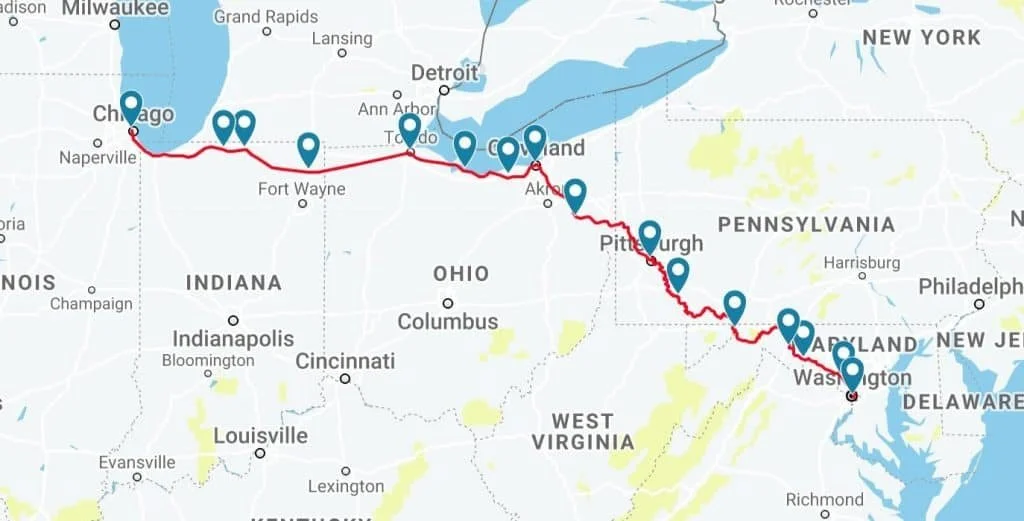
Capitol Limited ~ Washington DC > Pittsburgh, PA > Cleveland, OH > Chicago = 18h
126,309 passengers, 24.7% decrease from 2022
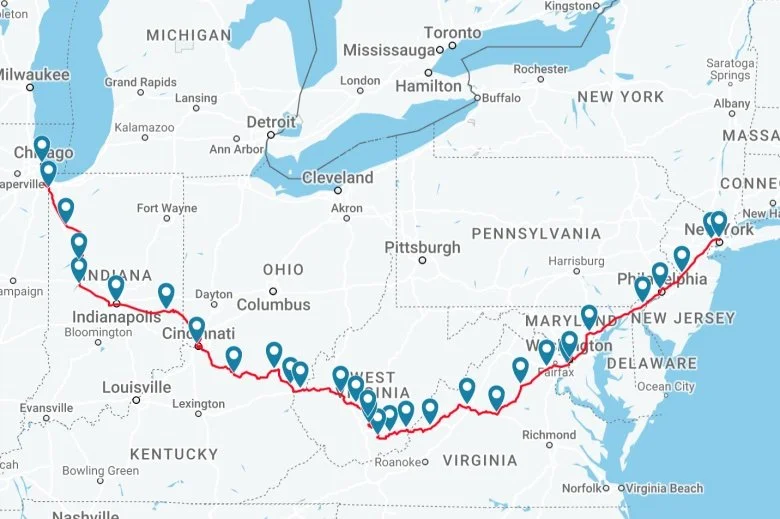
Cardinal ~ NYC > Charlottesville, VA > Cincinnati, OH > Indianapolis, IN > Chicago = 26h30m
82,705 passengers, 3% increase from 2022
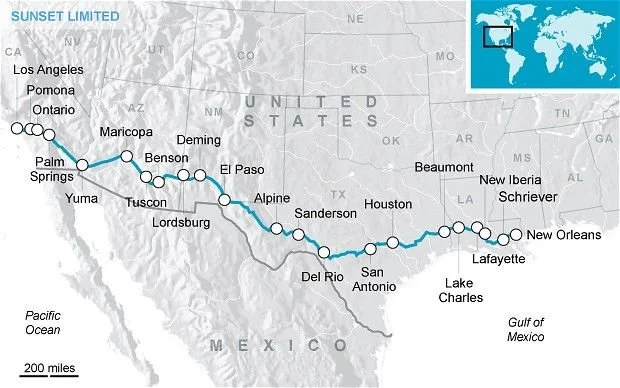
Sunset Limited ~ New Orleans, LA > San Antonio, TX > Tucson, AZ > Phoenix, AZ > LA = 48h
77,288 passengers, 4.6% increase from 2022
Top 10…by Overall Service Ridership +/-
Silver Meteor (NYC-Tampa/Miami) ~ +258.5%
City of New Orleans (Chicago-New Orleans) ~ +50.3%
Crescent (NYC-New Orleans) ~ +34%
Capitol limited (Washington DC-Chicago) ~ +24.7%
Texas Eagle ((Chicago-San Antonio, TX-LA) ~ +16.2%
Empire Builder (Chicago-Portland/Seattle) ~ +15%
Palmetto (NYC-Tampa/Miami) ~ +14.9%
Southwest Chief (Chicago-Kansas City-LA) ~ +13.5%
California Zephyr (Chicago-San Francisco) ~ +13.1%
Lake Shore Limited (Chicago-Boston/NYC) ~ +10%
Amtrak’s Planned Routes
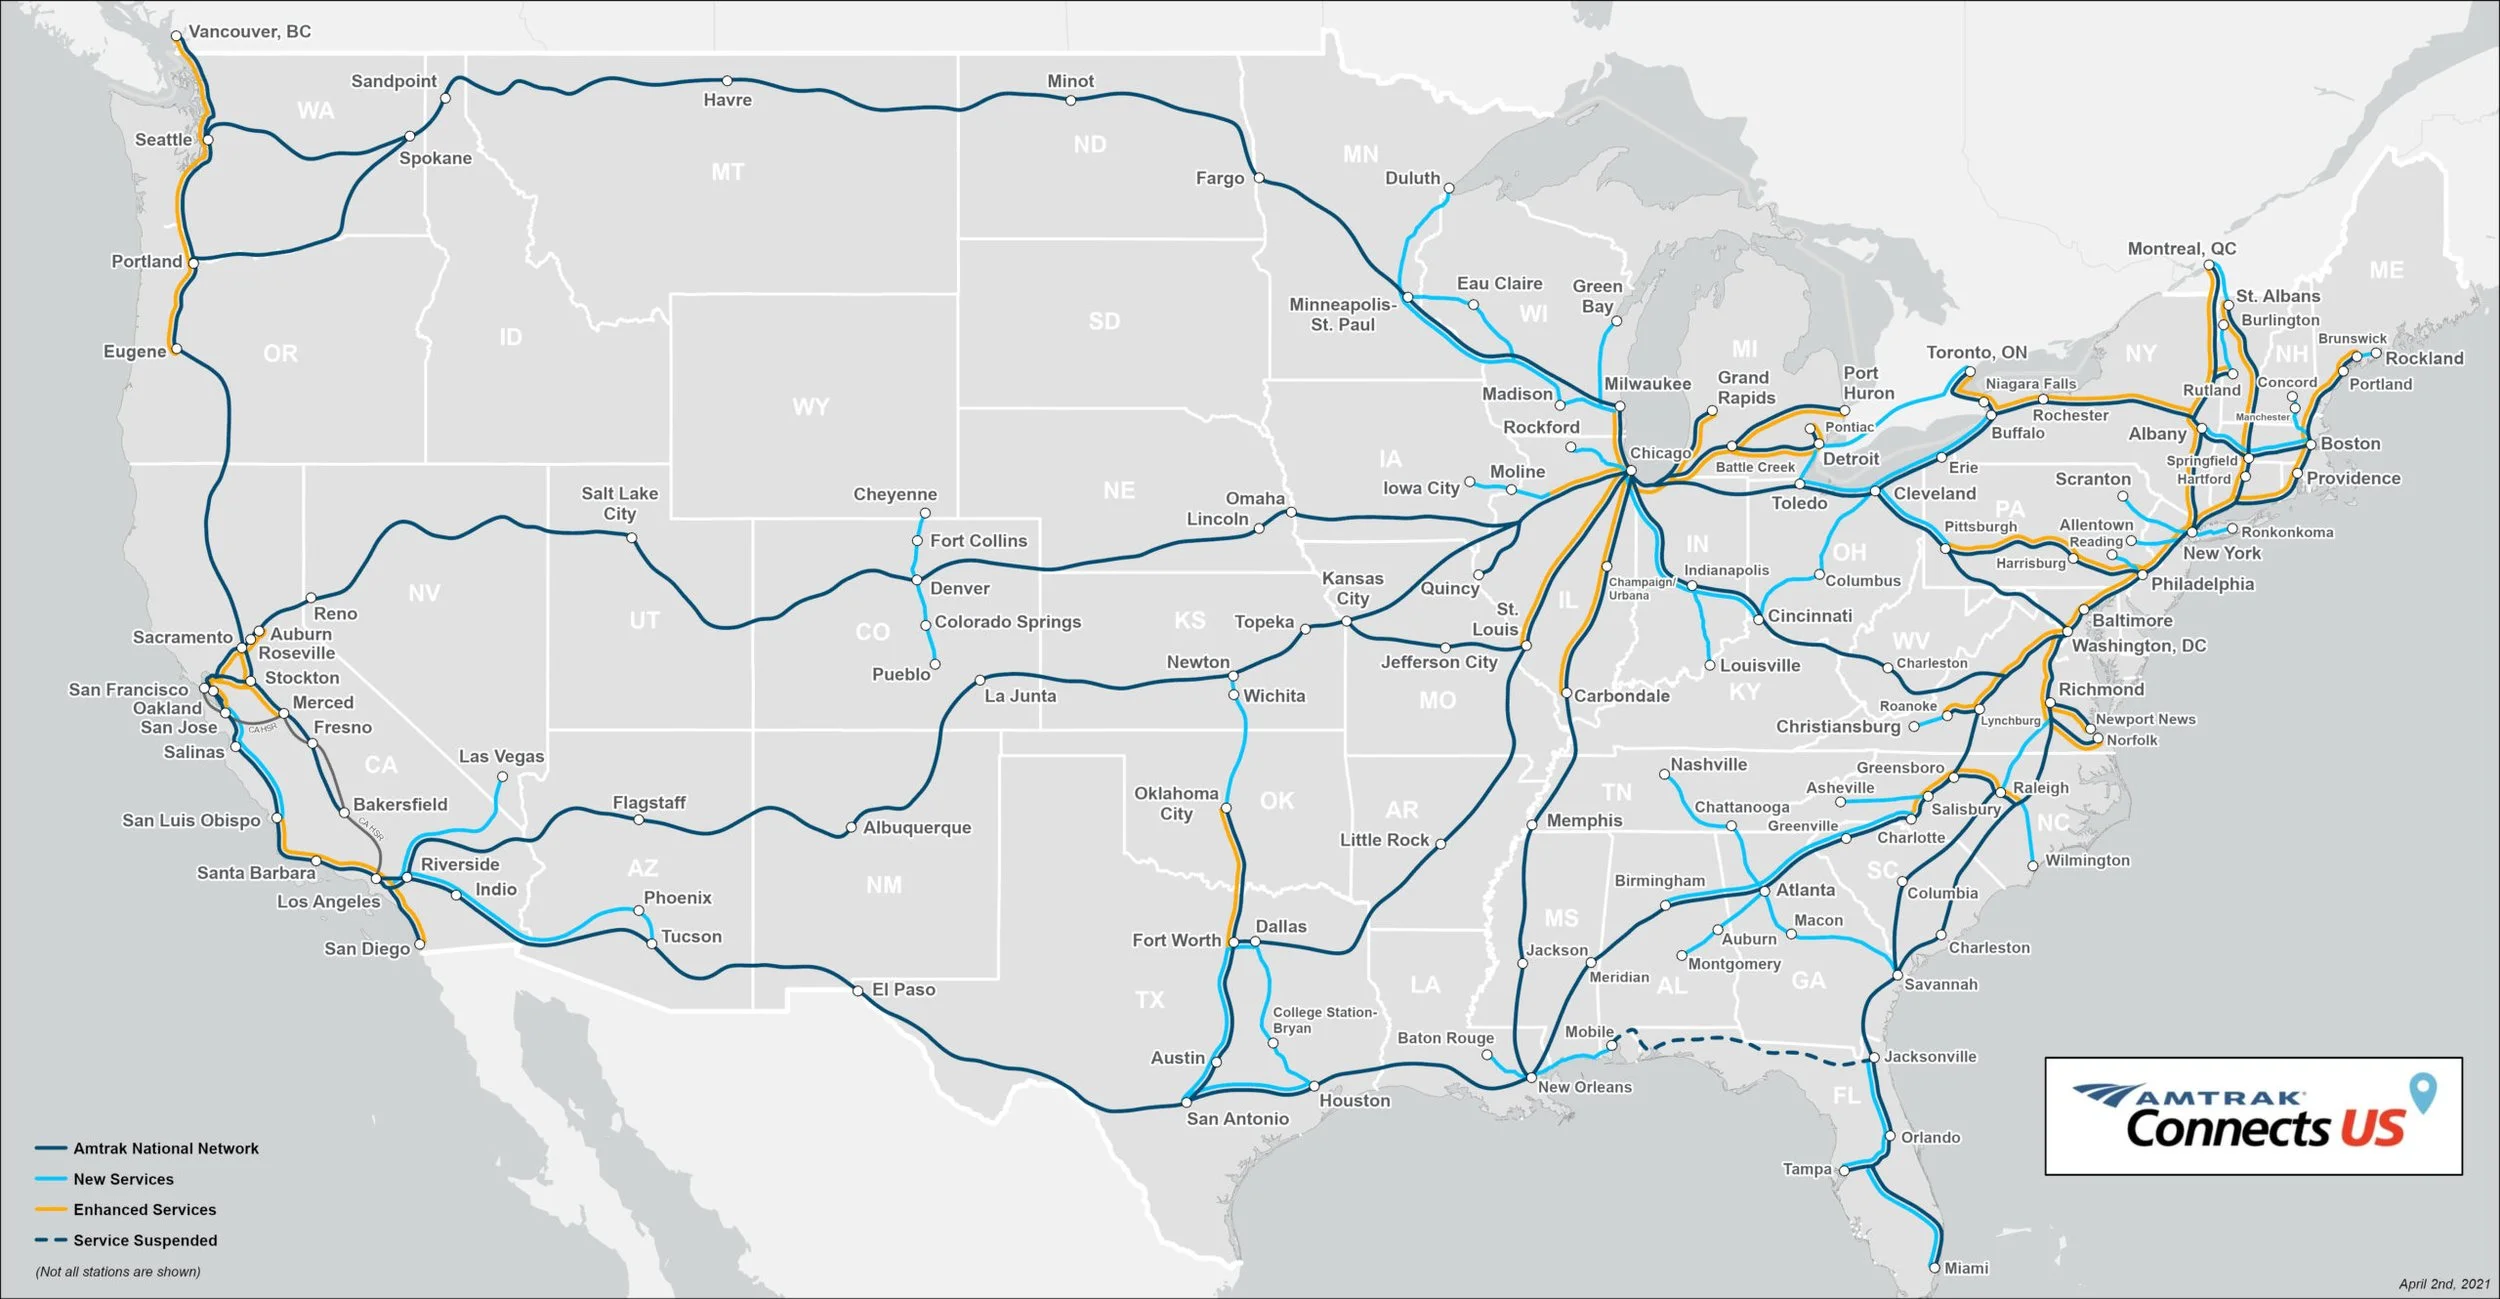
Planned Amtrak Corridors: 2035
Increase in service on each of these routes is needed to keep up with Amtrak’s goals of double current ridership by 2040. Over the next 15 years, Amtrak’s vision for expansion will connect up to 160 communities throughout the US. To achieve this, Amtrak is set to work with every region on the local-scale by building new or improved rail corridors in over 25 states. I could spend days talking Amtrak’s planned routes and their promised impacts, but I’ll just list a few of my choices here and link more of the full plans in the works cited below;
Planned Amtrak Routes: By The Numbers
Front Range Corridor (last service in 1970) ~
Pueblo, CO > Colorado Springs > Denver > Boulder, CO > Ft. Collins, CO > Cheyanne, WY = 5h34m
196,000 annual passengers estimated by 2035
2 daily roundtrips between Ft. Collins-Pueblo
1 daily roundtrip between Pueblo-Cheyanne
3C+D Corridor (last service in 1967) ~
Cleveland > Columbus > Dayton, OH > Cincinnati = 5h30m
385,000 annual passengers estimated by 2035
3 daily roundtrips between Cleveland-Cincinatti
Tucson-Phoenix Arizona Corridor (last service in 1996) ~
Tucson > Tempe, AZ > Buckeye, AZ > Yuma, AZ > LA = 10h11m
476,000 annual passengers estimated by 2035
3 daily roundtrips between Tucson-Phoenix-Buckeye, AZ
1 daily roundtrip between Tucson-LA
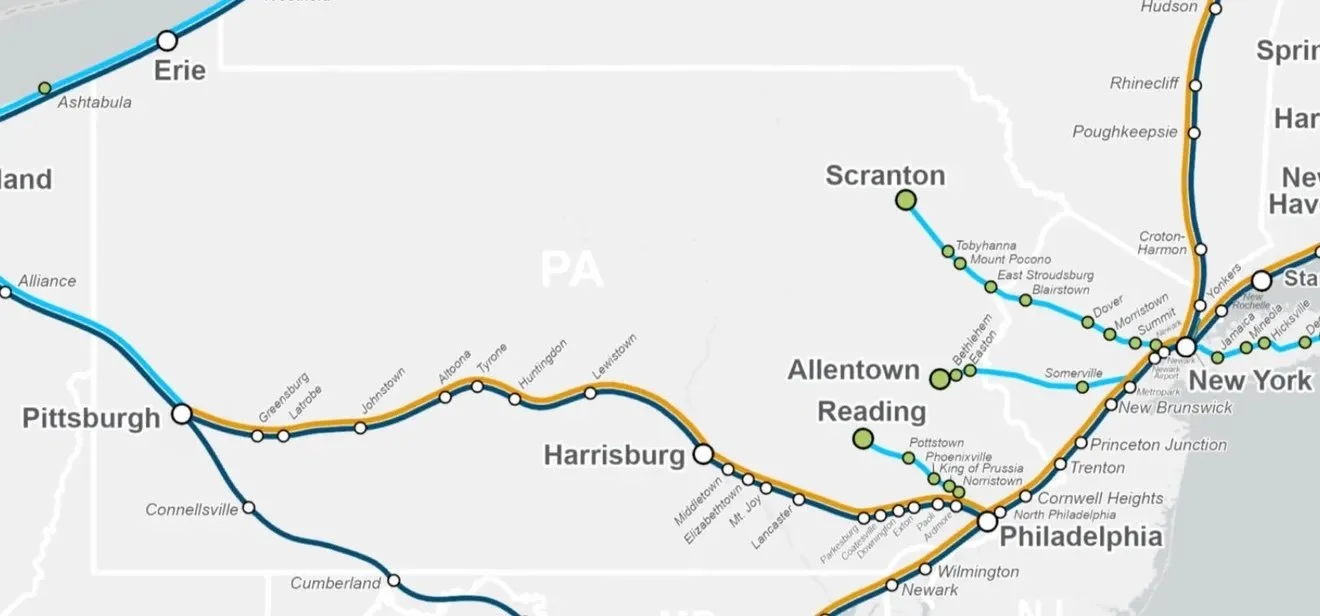
Allentown-NYC Corridor (last service in 1967) ~
NYC > Newark > Bethlehem, PA > Allentown, PA = 2h15m
400,000 annual passengers estimated by 2035
2 daily roundtrips between NYC-Allentown, PA
Reading-NYC Corridor (last service in 1981) ~
NYC > Trenton, NJ > Philadelphia > Norristown, PA > Reading, PA = 2h55m
400,000 annual passengers estimated by 2035
3 daily roundtrips between NYC-Reading, PA
Scranton-NYC Corridor (last service in 1970) ~
NYC > Newark > East Stroudsburg, PA > Scranton, PA = 3h25m
400,000 annual passenger estimated by 2035
3 daily roundtrips between NYC-Scranton, PA
courtesy of Amtrak study
However, these are only my picks. According to Amtrak, “If fully built out within fifteen years, Amtrak’s vision would increase Amtrak state-supported corridor ridership nationwide by 120%.” Since the 2021 release of their ‘Fifteen Year Vision,’ the US passenger rail service provider has set the statement-making to clear and concise. Reflecting this sentiment; the fifteen year route expansion goal of 39 new routes, 25 extensions, and 160 new stations. Providing Amtrak passenger rail service to the top 50 largest US metropolitan areas; as well as new stations in over half of all US states. There’s a host of all-new services coming online including;
Central Coast ~ San Jose, CA > Salinas, CA > San Luis Obispo, CA = 4h48m (3 daily roundtrips)
Las Vegas Service ~ LA > Fullerton, CA > San Bernardo, CA > Las Vegas = 6h45m (2 daily roundtrips)
Coachella Valley ~ LA > Palm Springs, CA > Indio, CA = 3h12m (4 daily roundtrips)
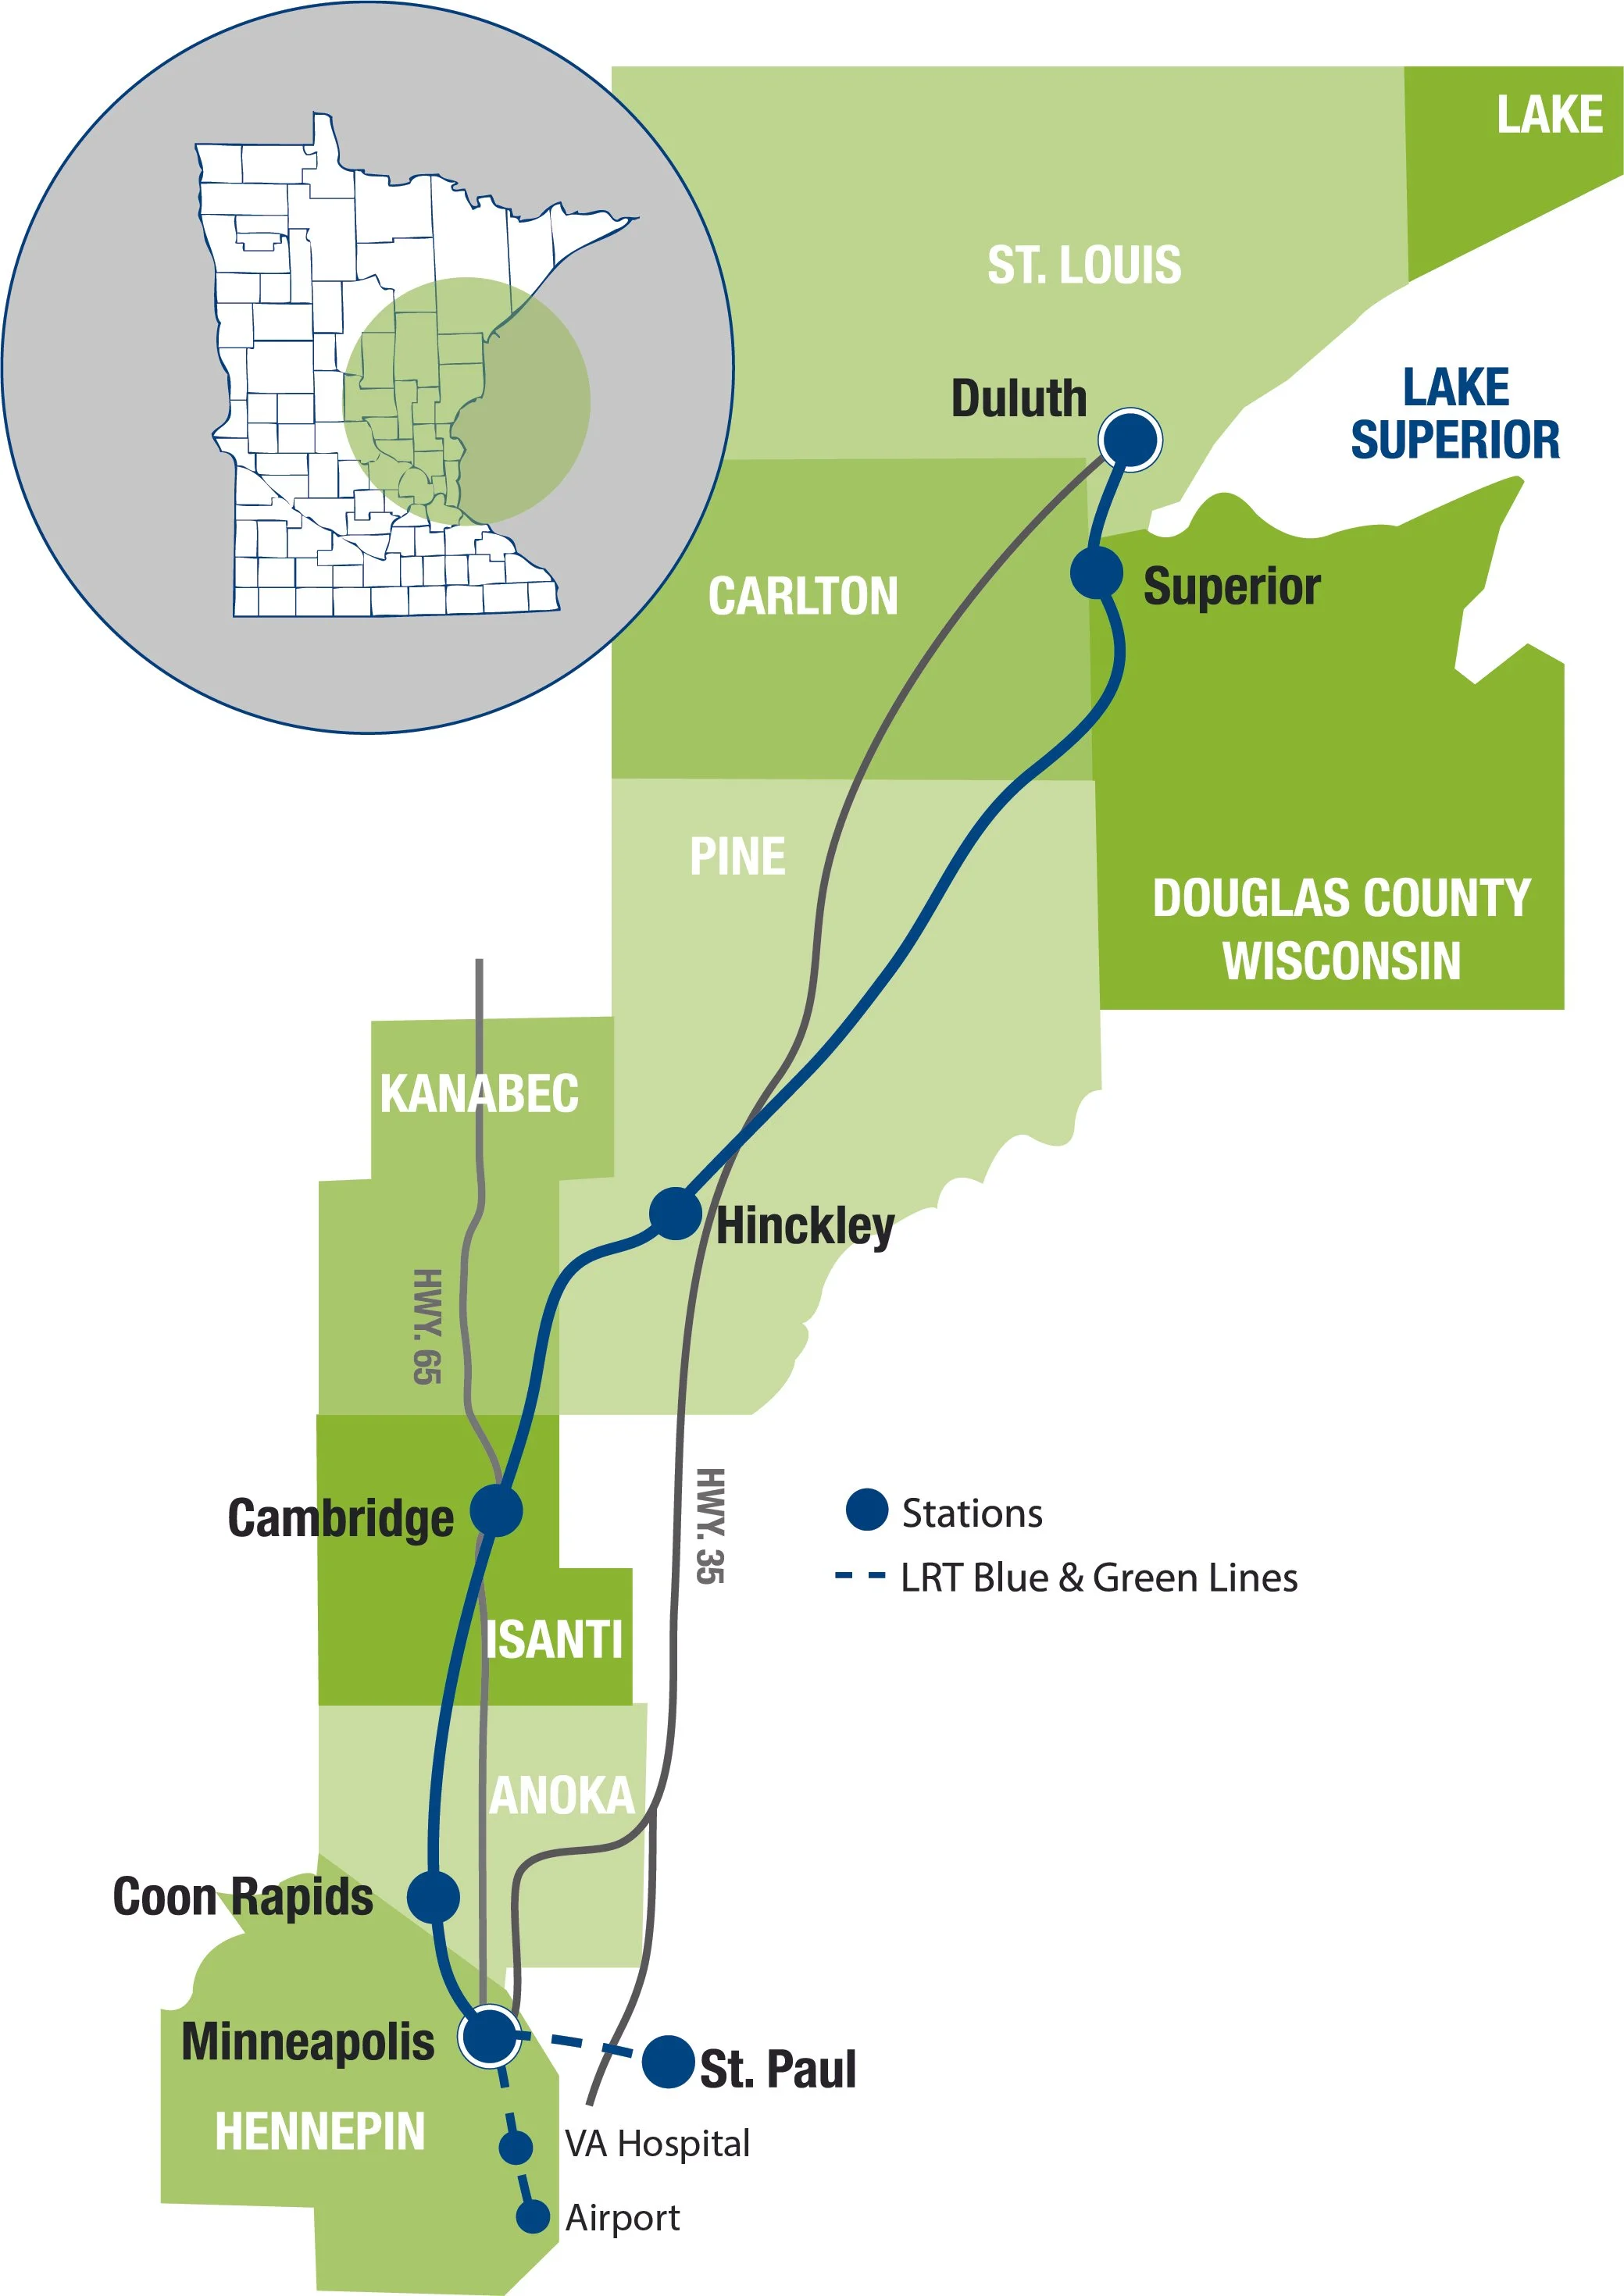
The Northern Lights Express ~ Minneapolis/St. Paul > Superior, MN > Duluth, MN = 2h35m (4 daily roundtrips)
Quad Cities ~ Chicago > Moline, IL > Davenport, IA > Iowa City, IA = 2h57m (2 daily roundtrips)
Rockford Line ~ Chicago > Huntley, IL > Rockford, IL = 1h51m (2 daily roundtrips)
Cleveland-Detroit Service ~ Cleveland > Toledo, OH > Detroit > Pontiac, MI = 3h18m (3 daily roundtrips)
Detroit-Toronto Service ~ Detroit > Windsor, ON > London, ON > Toronto = 4h46m (1 daily roundtrip)
Indianapolis Route ~ Chicago > Indianapolis, IN > Louisville, KY = 5h45m (4 daily roundtrips)
Manchester Service ~ Boston > Manchester, NH > Concord, NH = (5 daily roundtrips)
E - W Massachusetts ~ Boston > Palmer/Springfield, MA > Chatham/Albany, NY = 4h20m (2 daily roundtrips)
Long Island ~ Penn Station-NYC > Hicksville, NY > Ronkonkoma, NY = 1h25m (3 daily roundtrips)
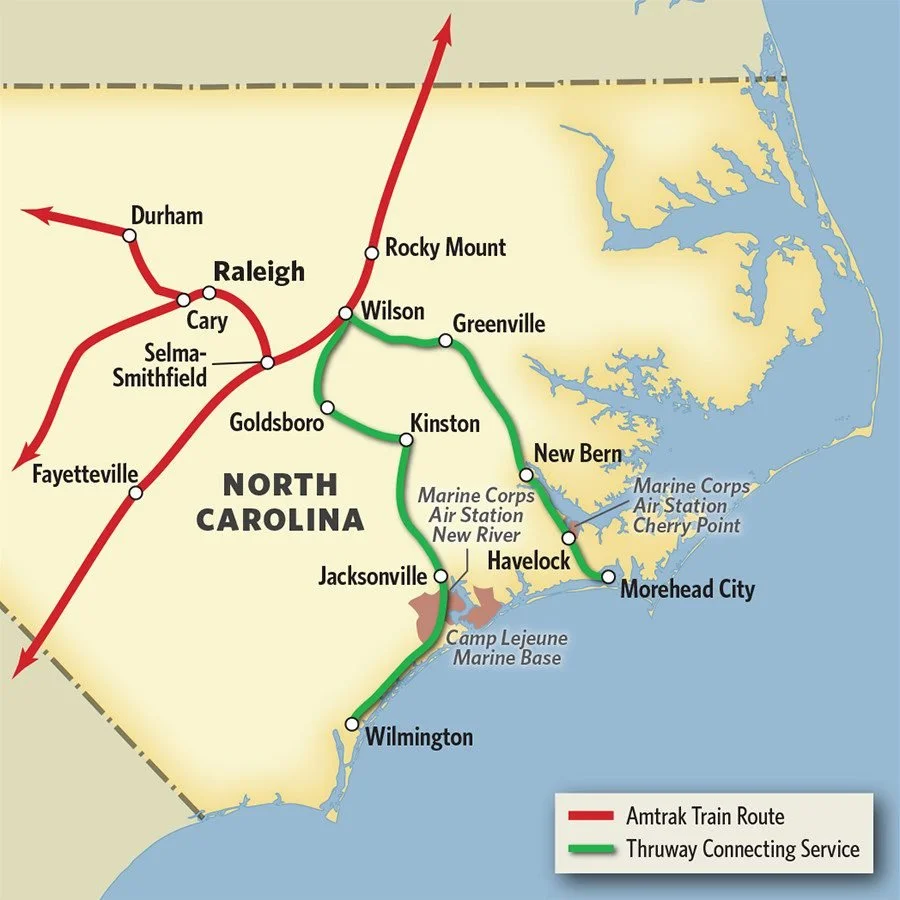
Western NC ~ Asheville, NC > Salisbury, NC = 3h45m (1 daily roundtrip)
Southeast NC ~ Raleigh, NC > Wilmington, NC = 2h48m (expanded Carolinian roundtrips)
Gulf Coast ~ New Orleans > Mobile, AL = 3h18m (2 daily roundtrips)
Baton Rouge ~ New Orleans > Baton Rouge, LA = 1h34m (2 daily roundtrips)
Planned Amtrak System Extension/Additions: By The Numbers
Heartland Flyer Extension ~ Oklahoma City > Guthrie, OK > Wichita, KS > Newton, KS
+2 daily roundtrip between Ft. Worth, TX-Oklahoma City (4h02m)
1 daily roundtrip between Ft. Worth, TX-Oklahoma City-Newton, KS (9h04m)
Texas Triangle Corridor ~ Houston > Dallas > Ft. Worth > Austin > San Antonio
3 daily roundtrips between Dallas/Ft. Worth-Houston (4h30m)
3 daily roundtrips between Houston-San Antonio (4h45m)
2 daily roundtrips between Dallas/Ft. Worth-Austin-San Antonio (6h)
Hiawatha Corridor Extensions ~ Chicago > Milwaukee > Madison, WI/Green Bay, WI
4 daily roundtrips between Chicago-Milwaukee-Madison, WI (1h48m)
3 daily roundtrips between Chicago-Milwaukee-Green Bay, WI (4h20m)
3 daily roundtrips between Milwaukee-Madison, WI-St. Paul/Minneapolis, MN (6h45m)
+3 daily roundtrips (10) between Chicago-Milwaukee (1h30m)
Atlanta Hub Corridor ~ Atlanta, GA > Charlotte, NC/Nashville, TN/Savannah, GA/Montgomery, AL
3 daily roundtrips between Atlanta-Charlotte, NC (5h)
2 daily roundtrips between Atlanta-Nashville, TN (6h34m)
3 daily roundtrip between Atlanta-Savannah, GA (5h40m)
3 daily roundtrips between Atlanta-Montgomery, AL (3h20m)
1 daily roundtrip between Atlanta-Birmingham, AL (4h10m)
Florida Network Corridor ~ Tampa > Orlando > Jacksonville, FL/Miami
+2 daily roundtrips (4) between Jacksonville-Orlando-Tampa (4h28m) Tampa-Orlando (1h32m)
+2 daily roundtrips (4) between Orlando-Miami (4h36m)
+3 daily roundtrips (4) between Tampa-Miami (4h34m)
These plans come in the wake of current Amtrak long distance popularity growing by 12% in the past year. They are also part of a bigger Corridor ID operation submitted to the Federal Railroad Administration (FRA); which also support more frequency on current Amtrak services including;
+20 daily roundtrips between San Diego-LA
+12 daily roundtrips between LA-Goleta, CA
+17 daily roundtrips between San Jose-Oakland
+5 daily roundtrips between Oakland-Sacramento
+9 daily roundtrips between Seattle-Portland, OR
+4 daily roundtrips between Portland-Eugene, OR
+2 daily roundtrips between Seattle-Vancouver, BC
+1 daily roundtrip between Champaign, IL-Chicago w/ faster speeds
+4 daily roundtrips between St. Louis-Chicago w/ faster speeds
+3 daily roundtrip between Chicago-Detroit
+1 daily roundtrip between Chicago-Port Huron, MI
+4 daily roundtrips between Chicago-Indianapolis, IN-Cincinnati, OH w/ faster speeds
+1 daily roundtrip between NYC-Pittsburgh, PA
+1 daily roundtrip between NYC-Cleveland, OH
+3 daily roundtrips between NYC-Roanoke, VA
+2 daily roundtrips between Boston/NYC-Norfolk/Newport News, VA
+2 daily roundtrips between NYC-New River Valley, VA
Not to mention expanded service between Charlotte, NC - Raleigh, NC - Richmond, VA - NYC; furthering the high speed capability and accessibility of Amtrak’s Northeast Corridor. Faster speeds of 110mph are planned in the midwest and expanded in the northeast. Furthermore, 205mph speeds are being planned by Amtrak on the ’Texas Triangle’ corridor; as Texas officials are currently working with planners from Japan.
Works Cited //
https://media.amtrak.com/wp-content/uploads/2023/11/Copy-of-FY23-Year-End-Ridership.pdf
https://media.amtrak.com/2023/11/amtrak-fiscal-year-2023-ridership-exceeds-expectations-as-demand-for-passenger-rail-soars/
https://www.whitehouse.gov/briefing-room/statements-releases/2023/11/06/fact-sheet-president-biden-advances-vision-for-world-class-passenger-rail-by-delivering-billions-in-new-funding/
https://amtrakguide.com/routes/
https://media.amtrak.com/amtrak-connects-us/#:~:text=Over%20the%20next%2015%20years,street%20and%20urban%20city%20centers.
https://azdot.gov/sites/default/files/2019/08/aprcs-record-of-decision.pdf
https://www.amtrak.com/content/dam/projects/dotcom/english/public/documents/corporate/reports/Amtrak-2021-Corridor-Vision-052721.pdf
https://www.dot.state.mn.us/nlx/
https://media.amtrak.com/wp-content/uploads/2021/05/Amtrak-2021-Corridor-Vision-May27_2021.pdf


