Redlining in the US
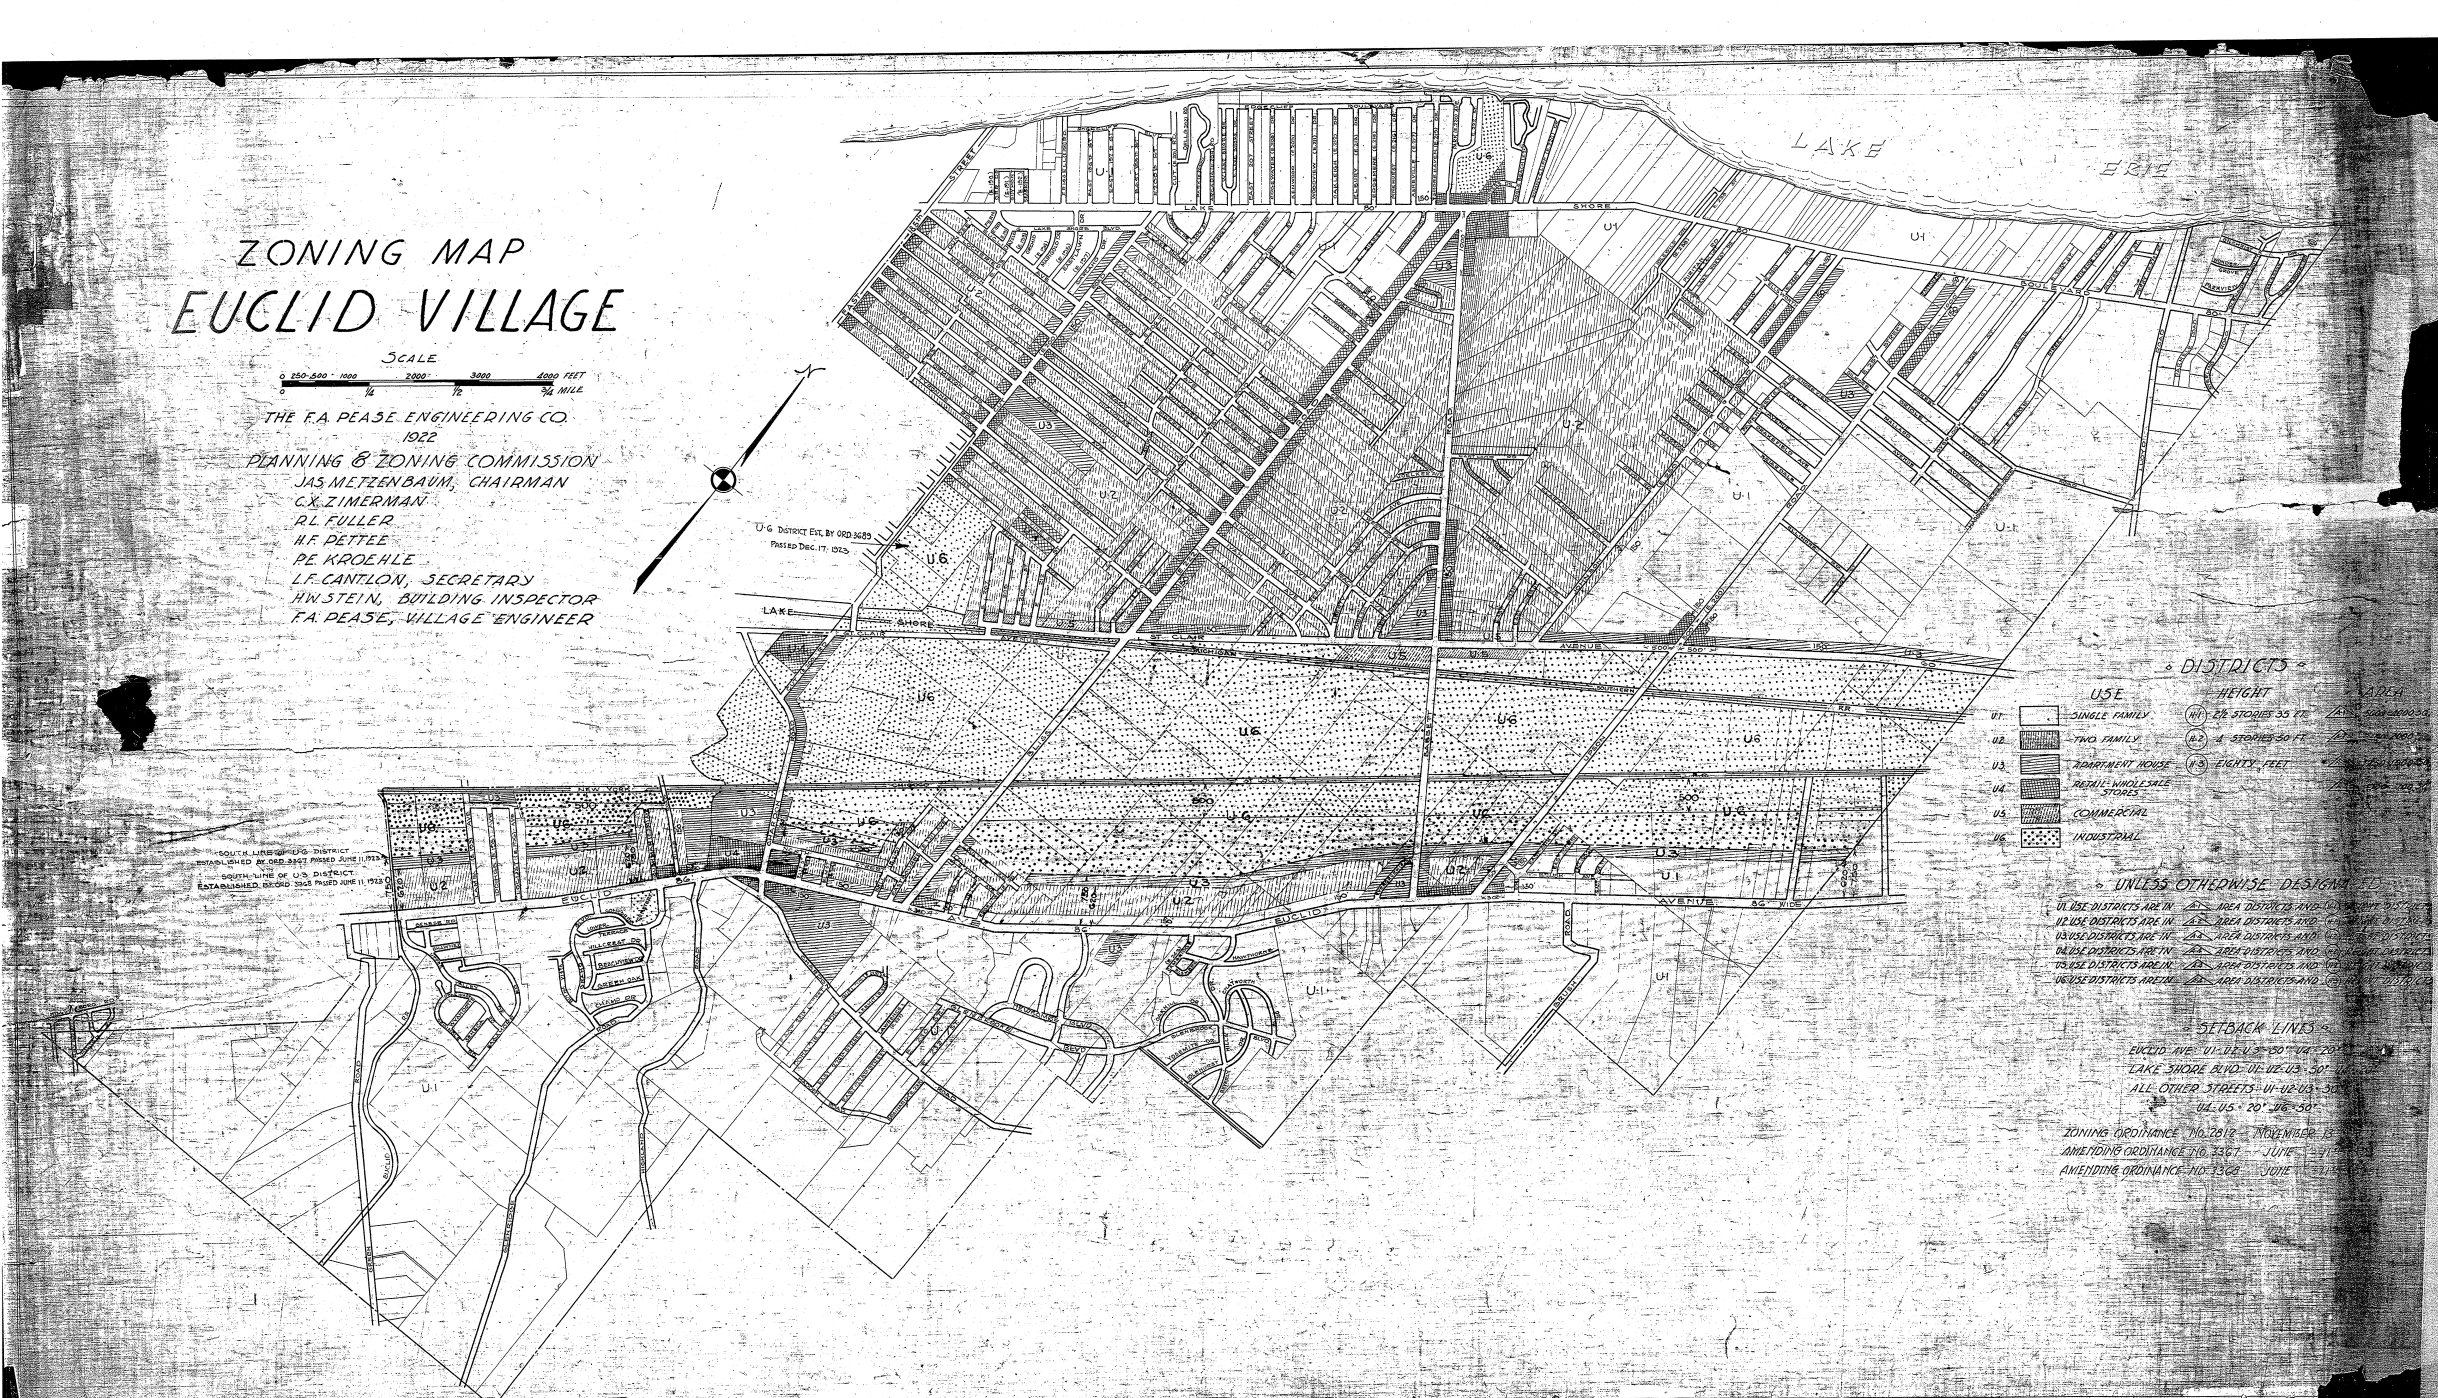
The story of what became ‘redlining’ begins with a zoning case in Ohio. The Ambler Realty Company owned 68 acres of land in the village of Euclid, Ohio, a suburb of Cleveland. On November 13, 1922, the village council passed a zoning ordinance dividing the village into several districts. The ordinance defined the use and size of buildings permissible in each district. Ambler Realty's land spanned multiple districts, and the company was therefore significantly restricted in the types of buildings it could construct on the land. Ambler Realty filed suit against the village, claiming the ordinance violated the Fourteenth Amendment's protections of liberty and property described in the Due Process and Equal Protection Clauses. A federal district court agreed and issued an injunction against enforcement of the ordinance. In a 6-3 opinion authored by Justice George Sutherland, the Court concluded that the speculative damages claimed by Ambler Realty were insufficient to invalidate an otherwise valid exercise of the village's police power. While Ambler had standing to sue, the Court rejected its arguments on the constitutionality of the zoning ordinance, which it found neither arbitrary nor unreasonable. Applying a deferential standard of review, as the Court typically applies to constitutional challenges to economic regulations, the Court held the ordinance did not exceed the local government’s police power. Zoning regulations, the Court explained, will generally be upheld as long as there is some connection to the public welfare.
1922 Euclid Zoning
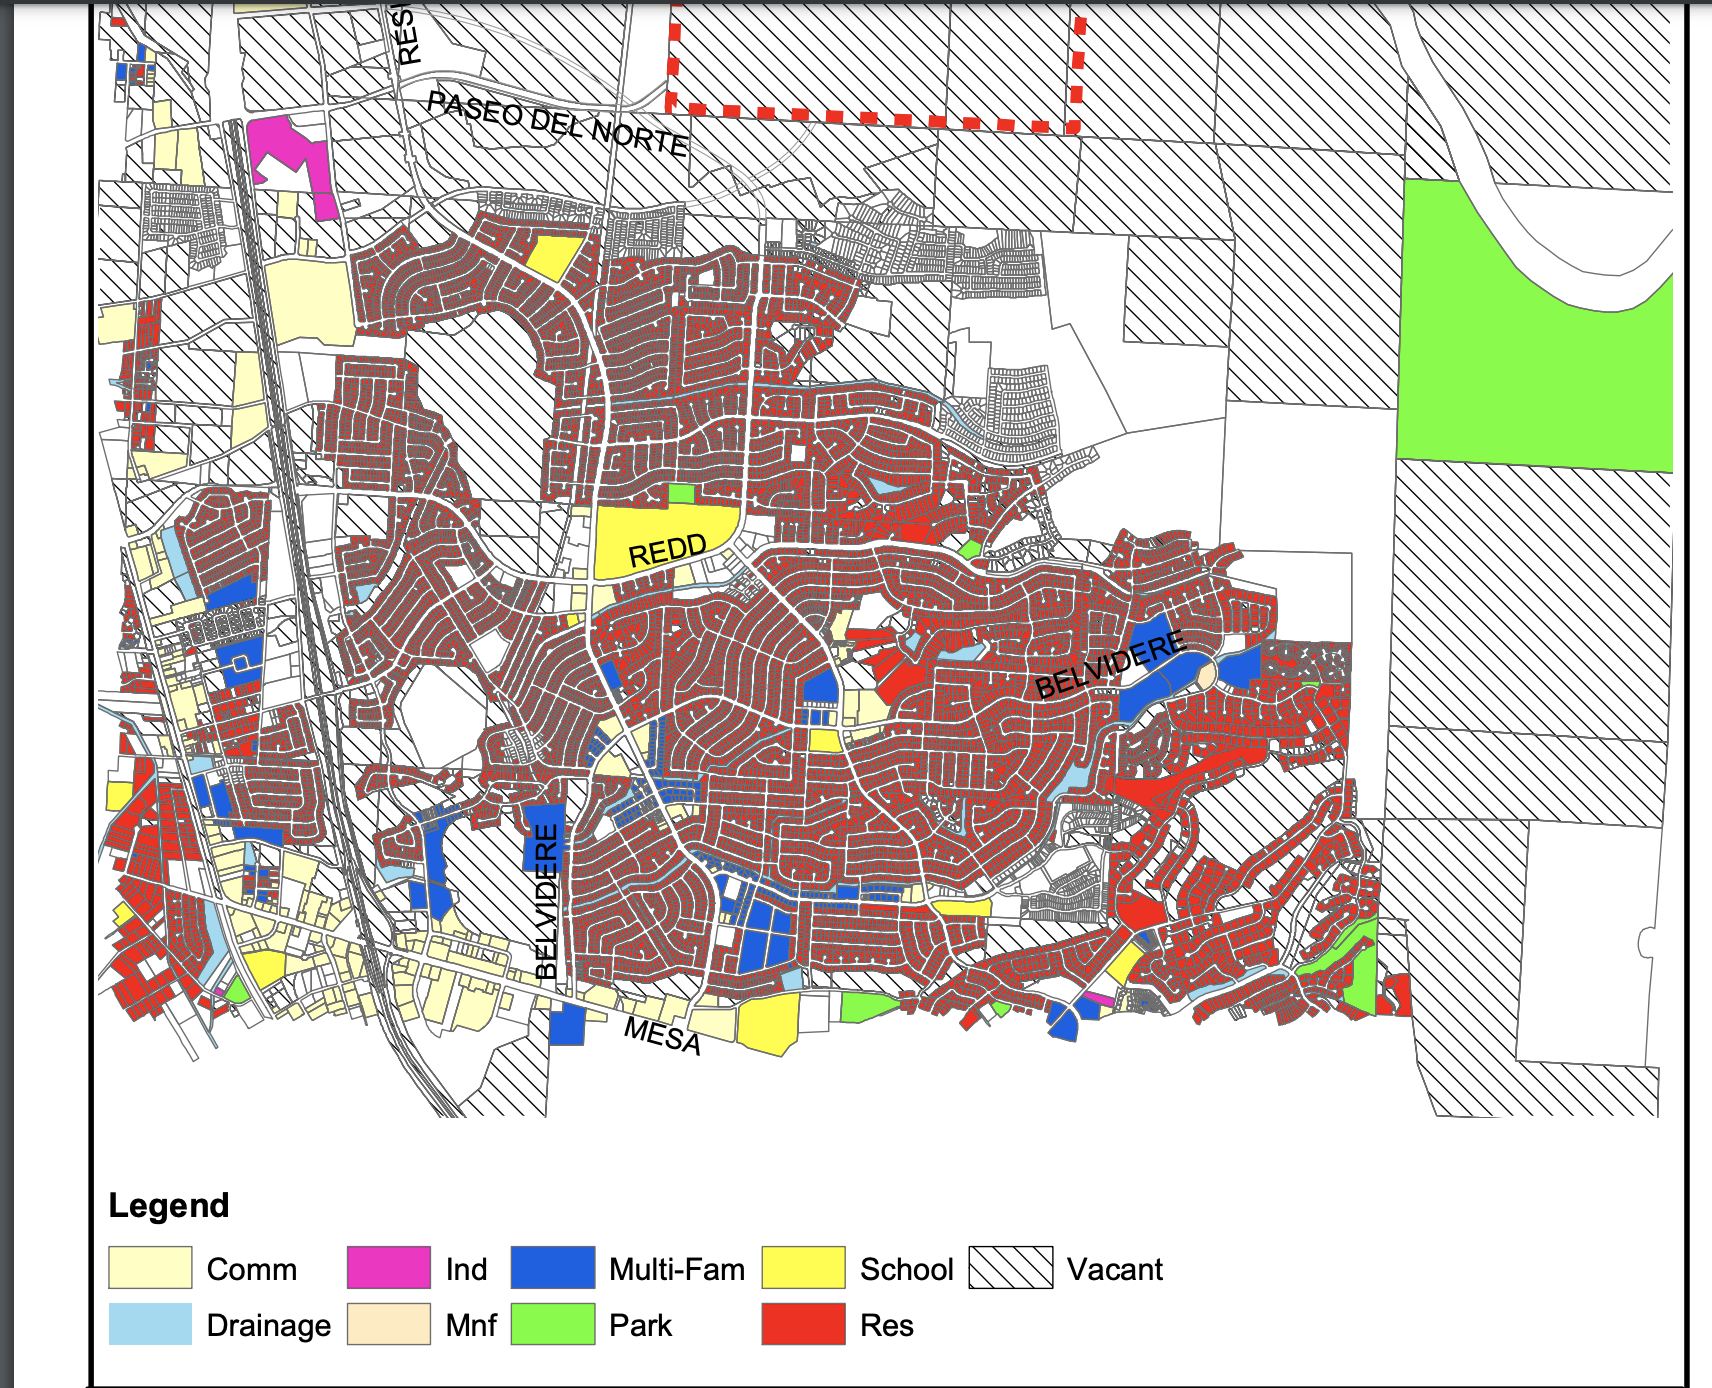
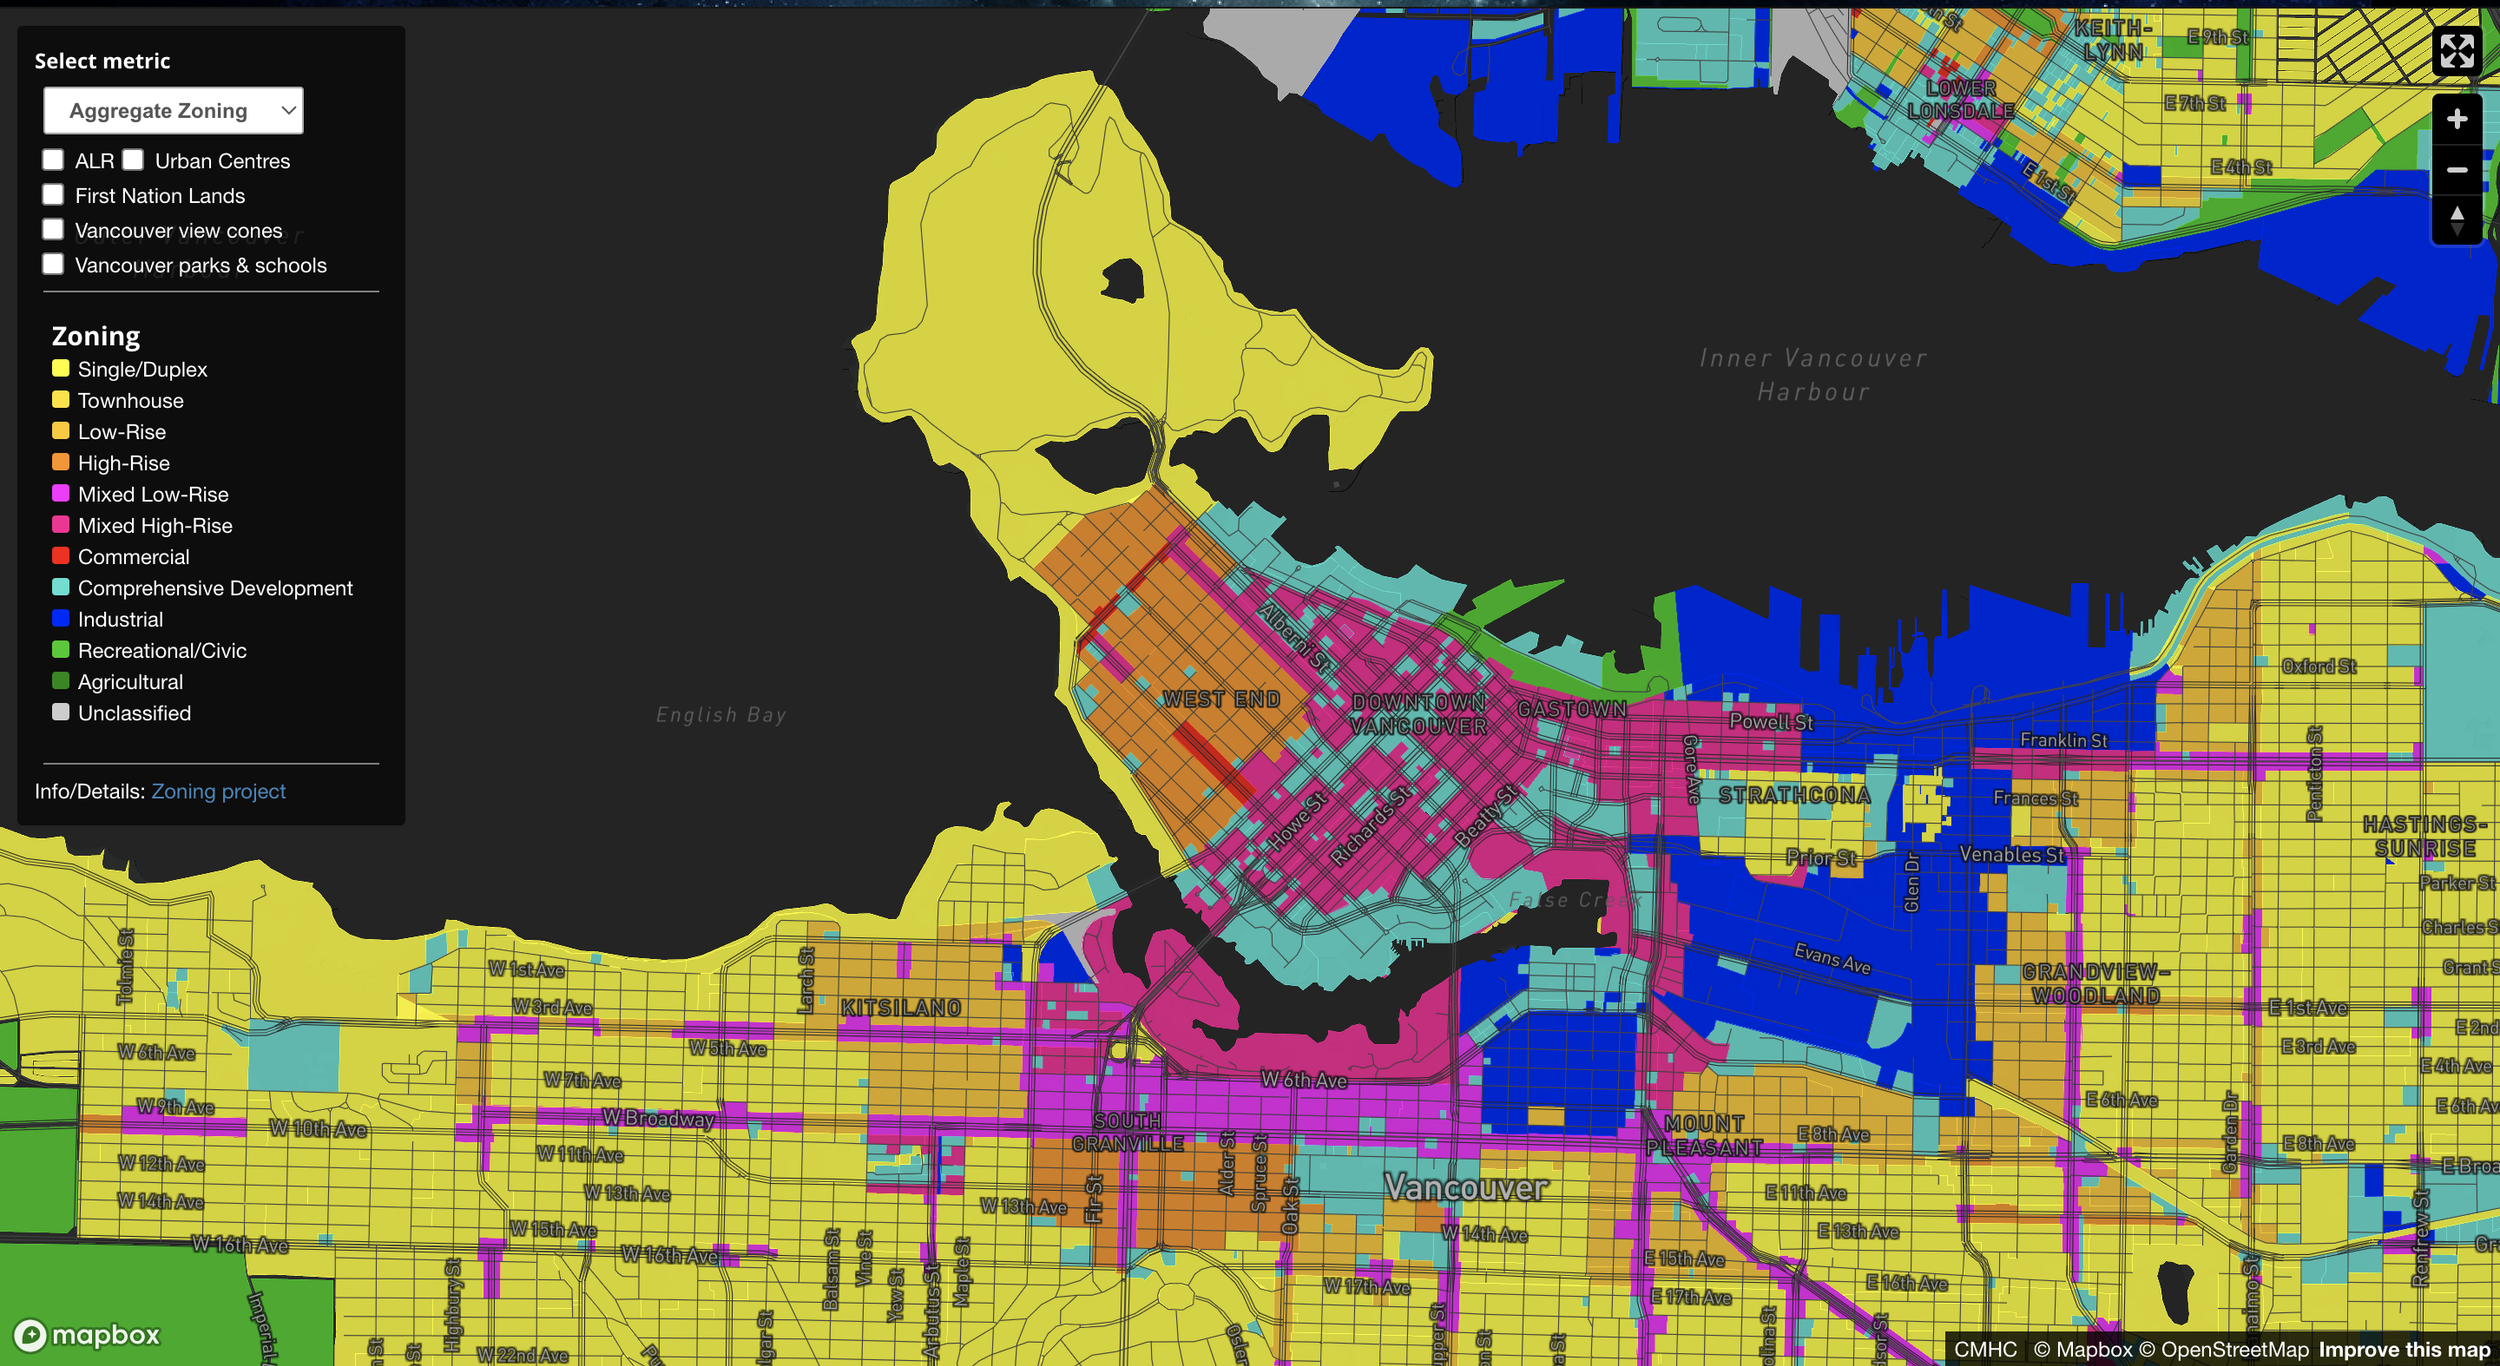
It is here where we discuss the general differences between Euclidian (named for Euclid, OH) and mixed zoning. Within the lines drawn by Euclidian Zoning certain area are designated residential, commercial, or manufacturing or industrial districts. In the last 60 years, the United States has gone on to generalize these zoning districts even more by seperating residential types so that large swaths of single family home neighbors will drive profit to the developers. In a lot of these areas it is illegal to build dense residential space. This inefficient way of building can be safe using mixed zoning. A common sense approach to zoning where two or more land uses in a single development (typically retail and residential) are present. As you can see this shows up pretty well on zoning maps. Here is a 21st century comparison of the primarily Euclidian zoning in El Paso, Texas (pop. 677,456) and the mixed zoning development Vancouver, British Columbia (pop. 675,218).
2005 El Paso Euclidian Zoning
2023 Vancouver Mixed Zoning
As Euclidian zoning spread around the US like wildfire; the first Levittown soon became a seemingly endless ocean of single family homes outside of more and more cities. Propagating even still. The proliferation of an “arbitrary” idea called “the American dream” created this sameness in what is thought to be right. What is thought of to be a goal. However, the “American dream” was never said to be sustainable for those who could afford it. For mostly those who could not afford to think of some arbitrary dream were the countless people of color marginalized by the zoning policies enacted in the ‘20s and the degeneration of public policies post Great Depression.
In 1940, the Federal Home Owner Loan Corporation (HOLC) created their first Residential Security Maps. ‘Redlining’, a term that was coined later, now could be federal policy. Refusal to give loan or insurance to someone because they live an area deemed to a be a “poor financial risk” was not possible. Not only setting the stage to ‘redlining’, but also the building of the many ‘projects’ in the US and today’s “housing crisis’ situation had been set in motion. To visualize a few examples; I’ve acquired the help of University of Richmond’s Mapping Inequality program (which I have cited in the sources). These zoning maps, from Ohio Metropolitan Security Maps, are for the cities of Akron, Canton, Cleveland, and Youngstown, Ohio from 1940. As you can on the maps, each area is marked on a scale. 'A' being “best”, ‘B’ being “Still Desirable”, ‘C’ being “Definitely Declining”, ‘D’ being “Hazardous”, and it goes without saying these neighborhoods with majority people of color where more often than not marked as ‘D.’ If you, for some reason, didn’t think that was the case; well then the map goes out on a limb and just say it outright. As according to the 1940 HOLC map these ‘D’ areas are “characterized by detrimental influences in a pronounced degree, underdesirable population or an "infiltration" by it.” It was by the 1960s; the term ‘redlining’ would be coined because federal government and lenders would literally draw a red line around these neighborhoods on the map.
Though, like most things, the reality of history doesn’t really hit home until it literally hits home. After looking at these maps and more in Ohio along with across the country. Reading each neighborhood’s description, as well as realigning these maps to ones of today. All I can say is, personally it gives a new perspective of what is from what was. Something you will never know, especially if you’re white, because of a system that does not allow you to know. Many of these neighborhoods, in which have descriptions of sickening racism, ended up with an interstate puncturing through the culture and economy of those neighborhoods to be passed by. Here are statistics I’ve found on each city;
*warning some of the district descriptions are super racist and for the curious it gets much worse the more you look in Mapping Inequality (again in the sources)
Akron, Ohio
16% - A, 20% - B, 55% - C, 9% - D
City Pop. 244,971 (1940), 189,347 (2021)
District D-4: "Most of the area lying south of Bartges Street has soft foundation due to nearby Summit Lake (southern boundary). Homes located on Norka, Raymond and the south end Snyder, Scheck, Metzger and Bowery Street are out of “plumb” owing to the shifting foundation. Heavy traffic along Wooster Avenue, Thornton and Bowery Streets. District affected by odors, smoke, and dirt from nearby Goodrich Rubber Company plant. Acquired property if not sold immediately will suffer from vandalism. Declining district, heavily populated by low class Jews – all stores on Wooster Avenue (traversing artery) are Jewish-owned. Present heavy negro encroachment gradually increasing.” - HOLC ‘39
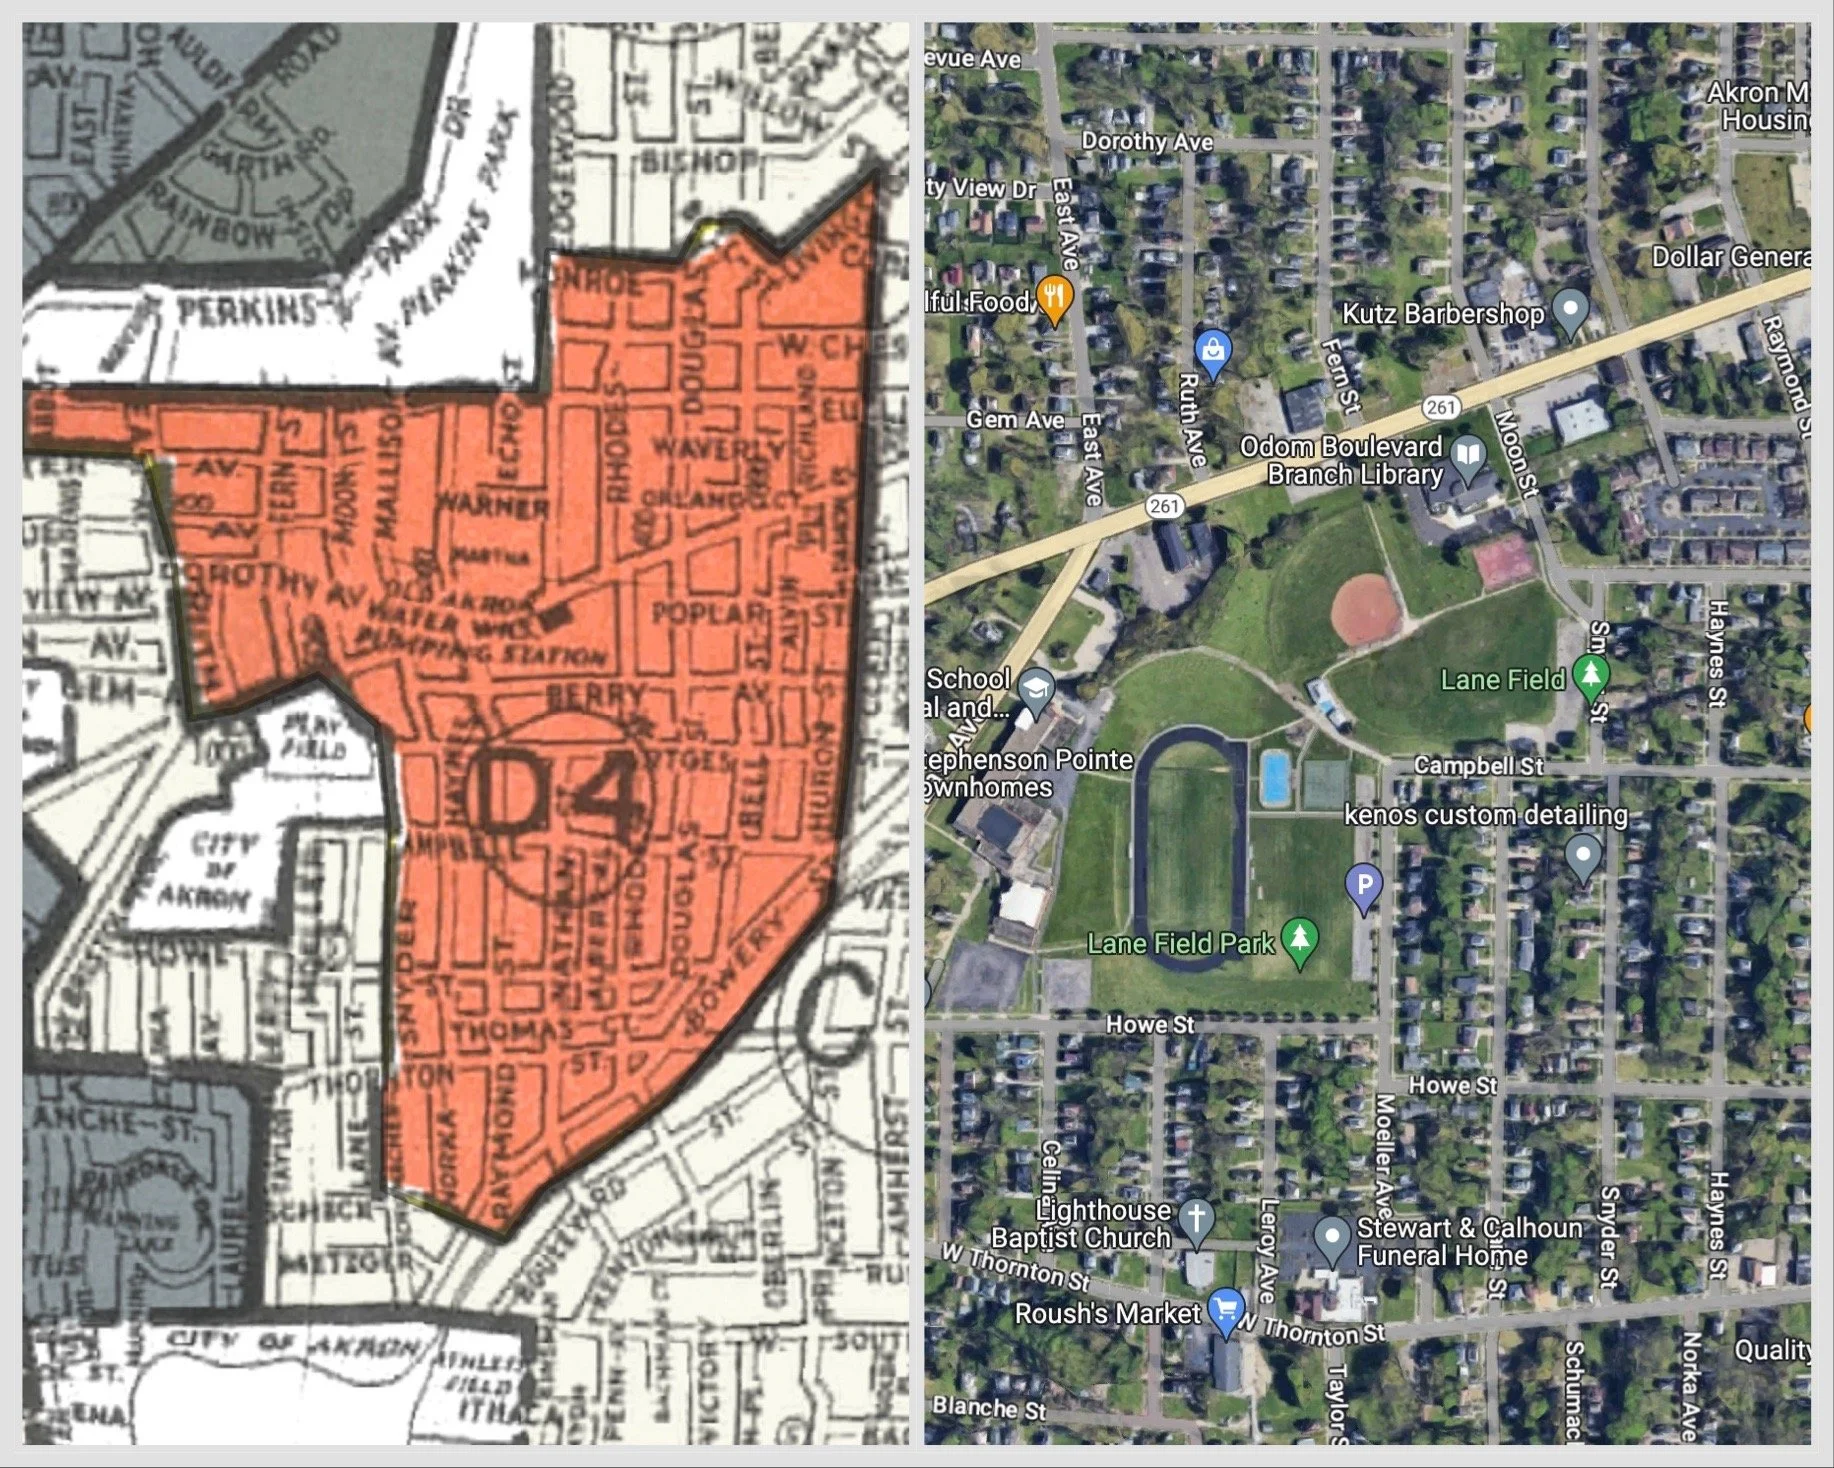
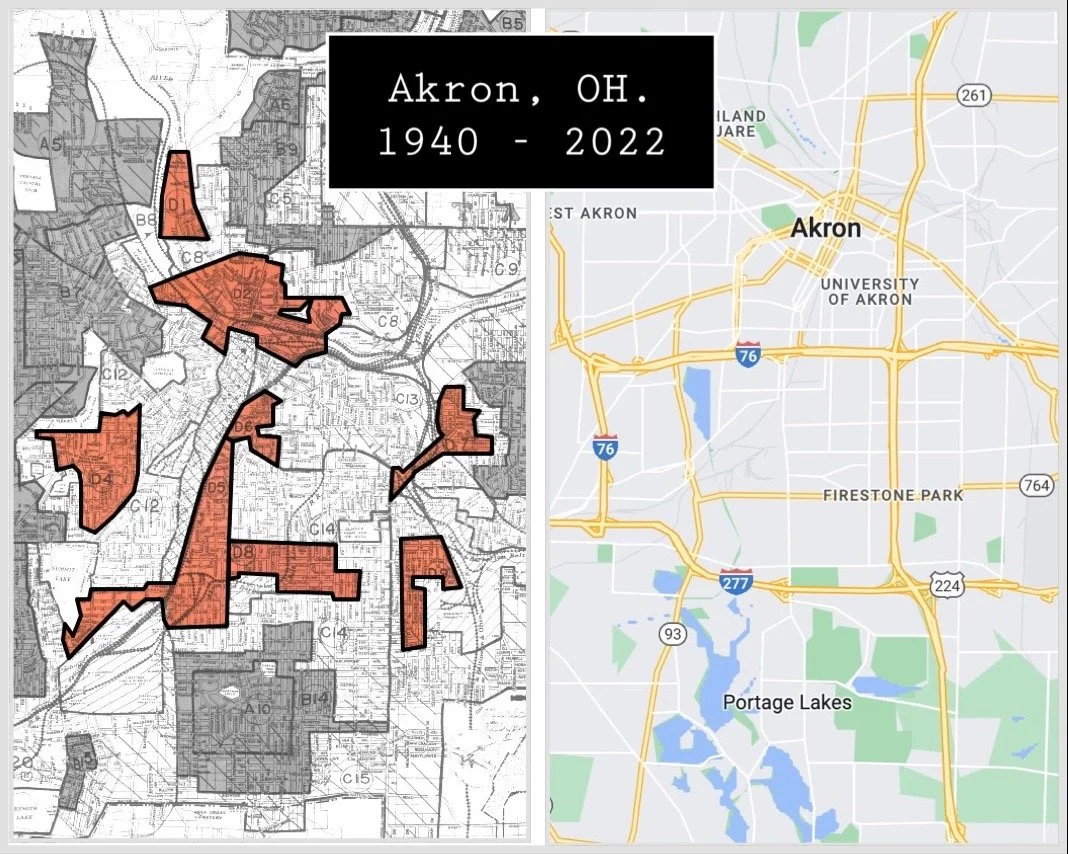
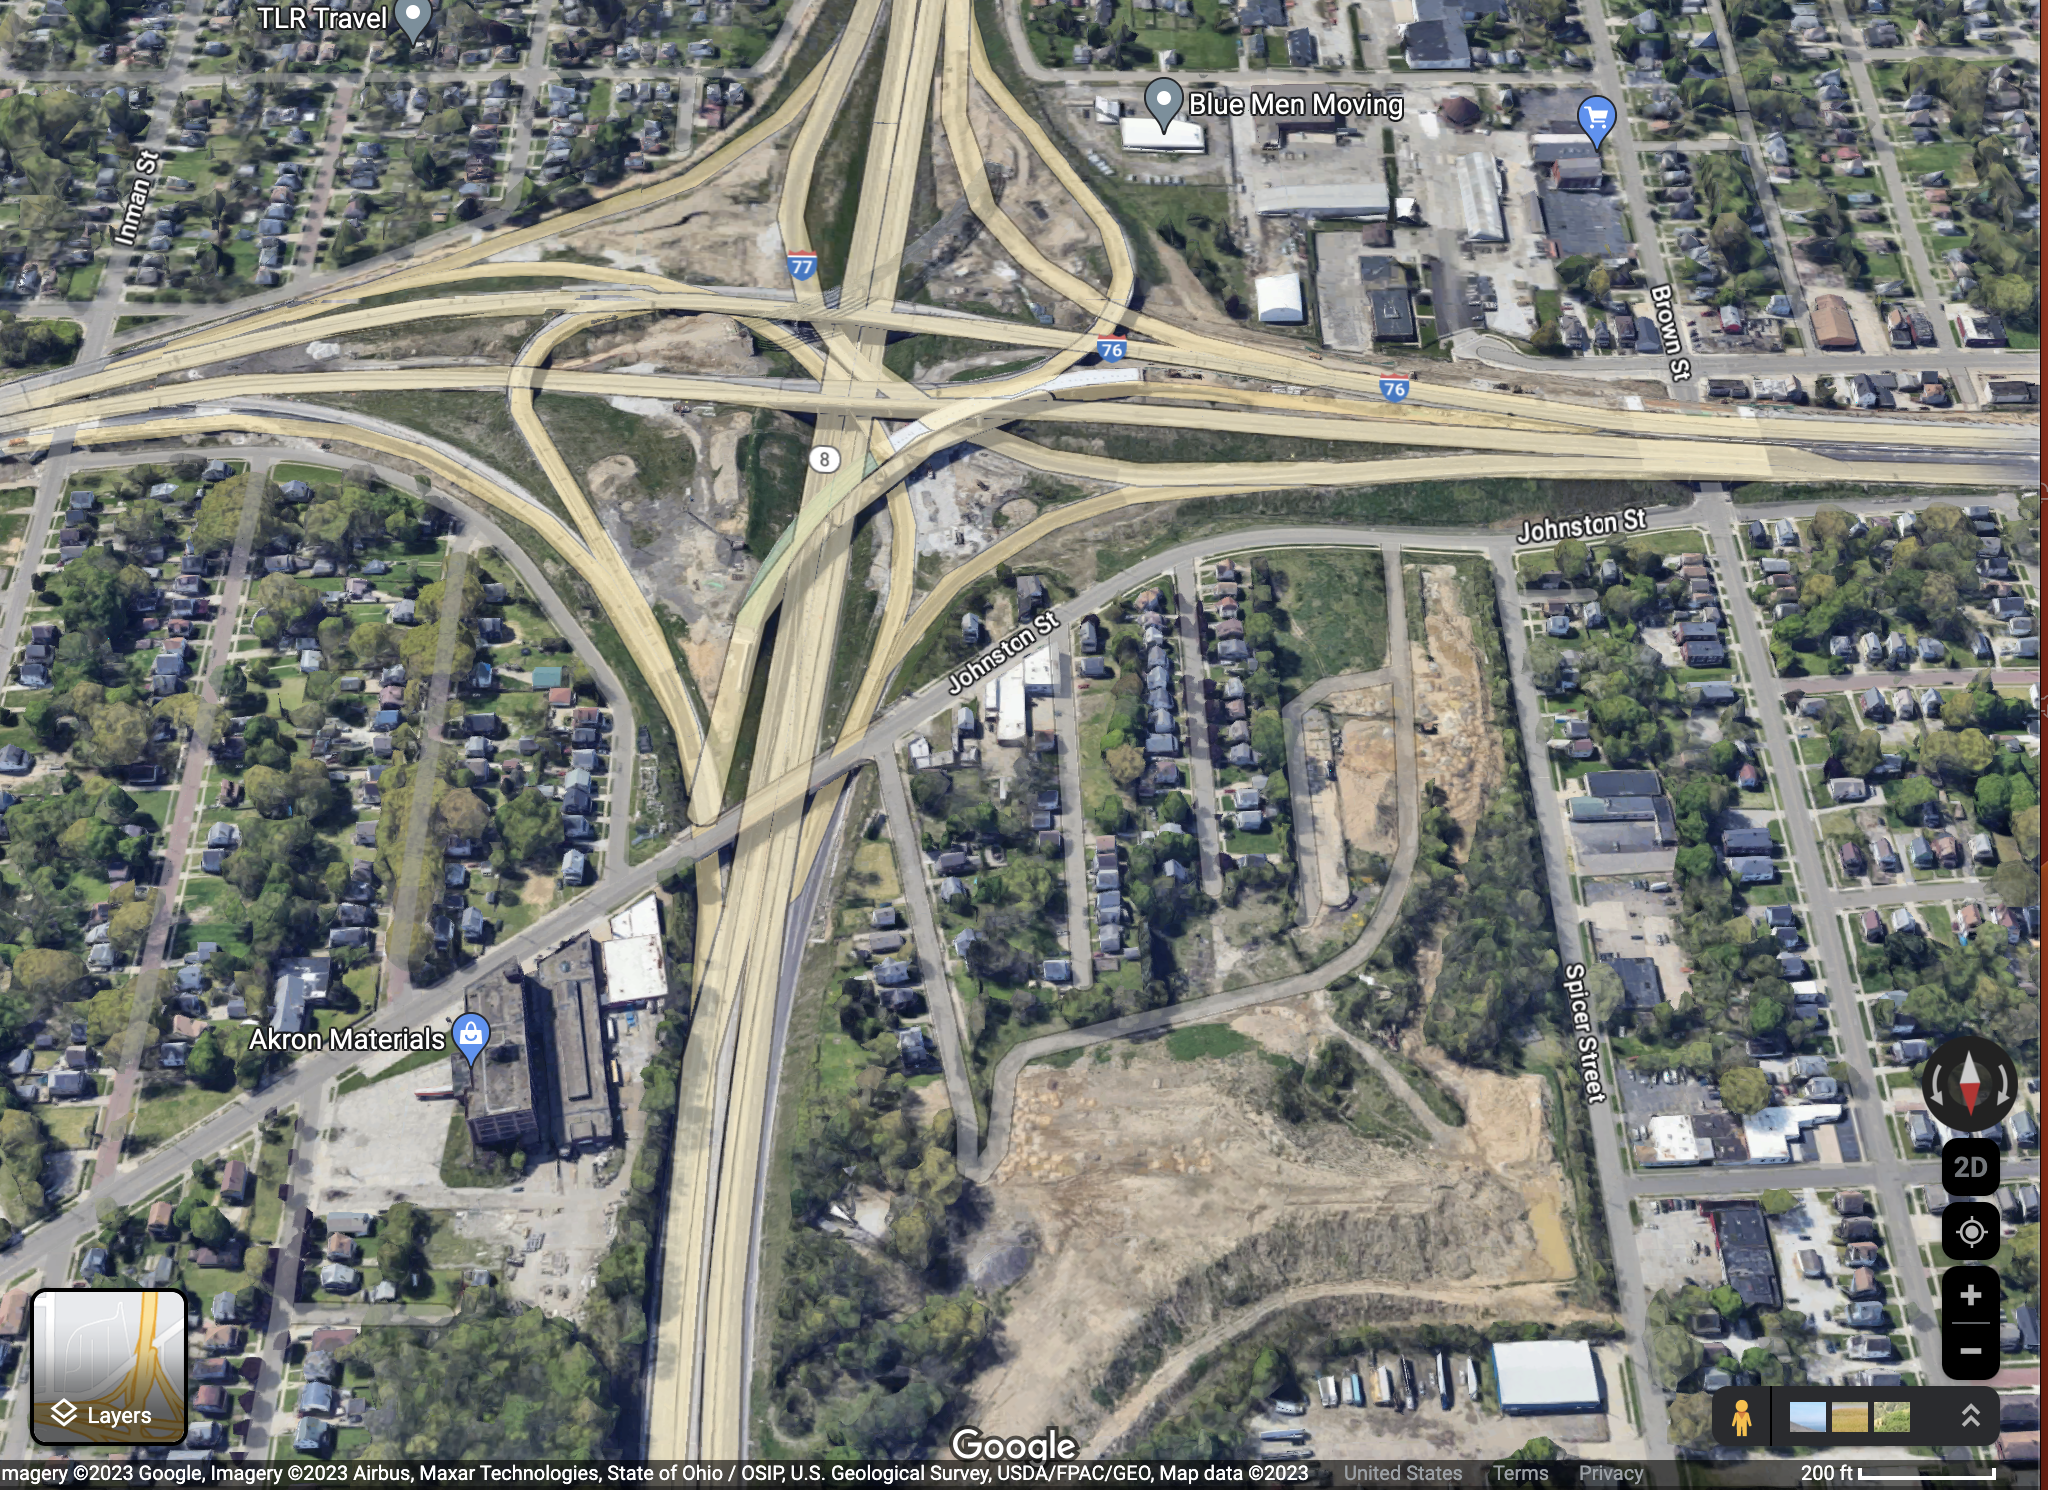
HOLC Map, Akron. OH. 1940
Youngstown, Ohio
4% - A, 11% - B, 43% - C, 42% - D
City Pop. 167,720 (1940), 60,270 (2021)
District D-6: "Slight infiltration of Negro population. Both sides of Market Street is being taken over by stores. Very old section of city. Dirt and noise. On the down grade.” "One of oldest residential sections in Youngstown. Trend is downward. Property, if acquired, should be sold rather than held.” - HOLC ‘40
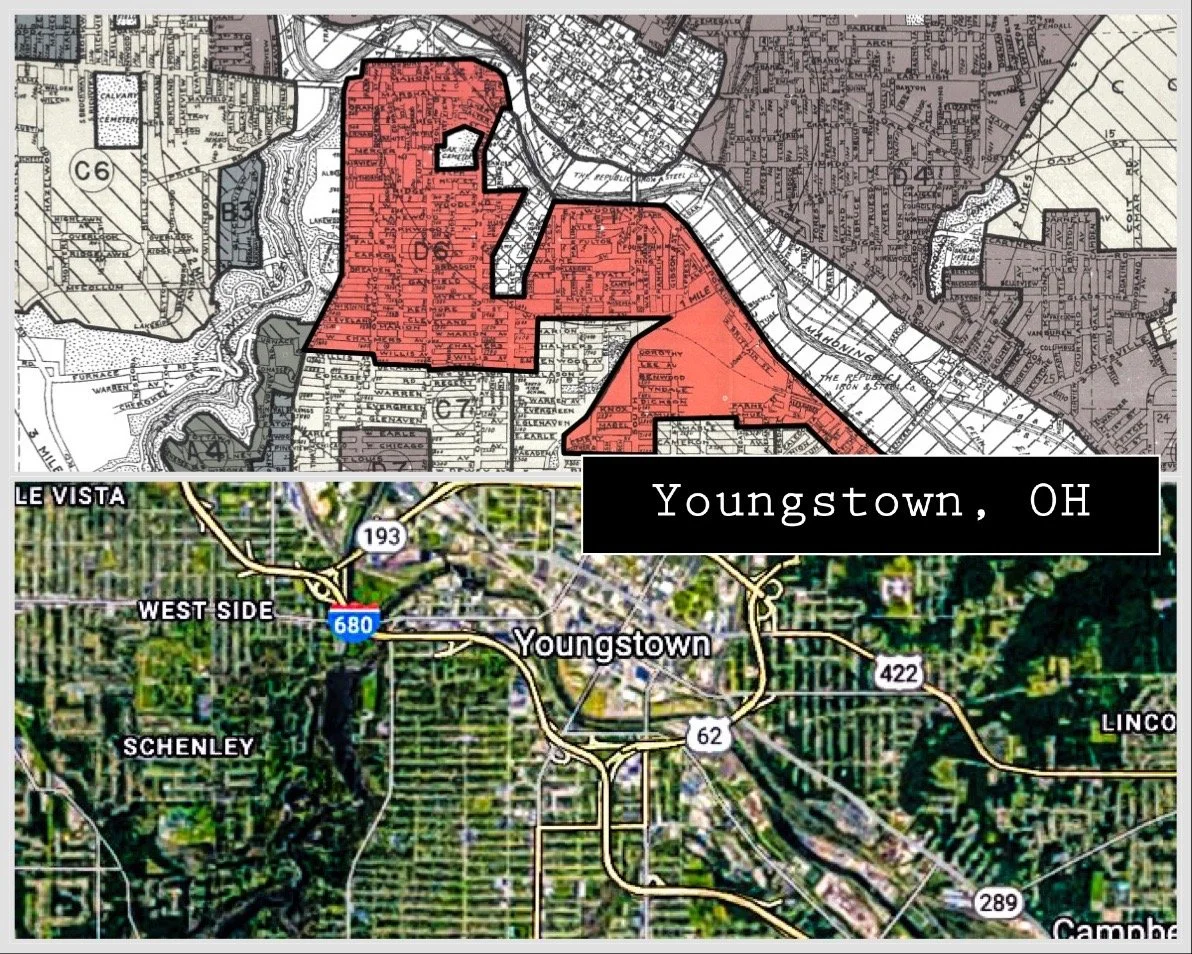
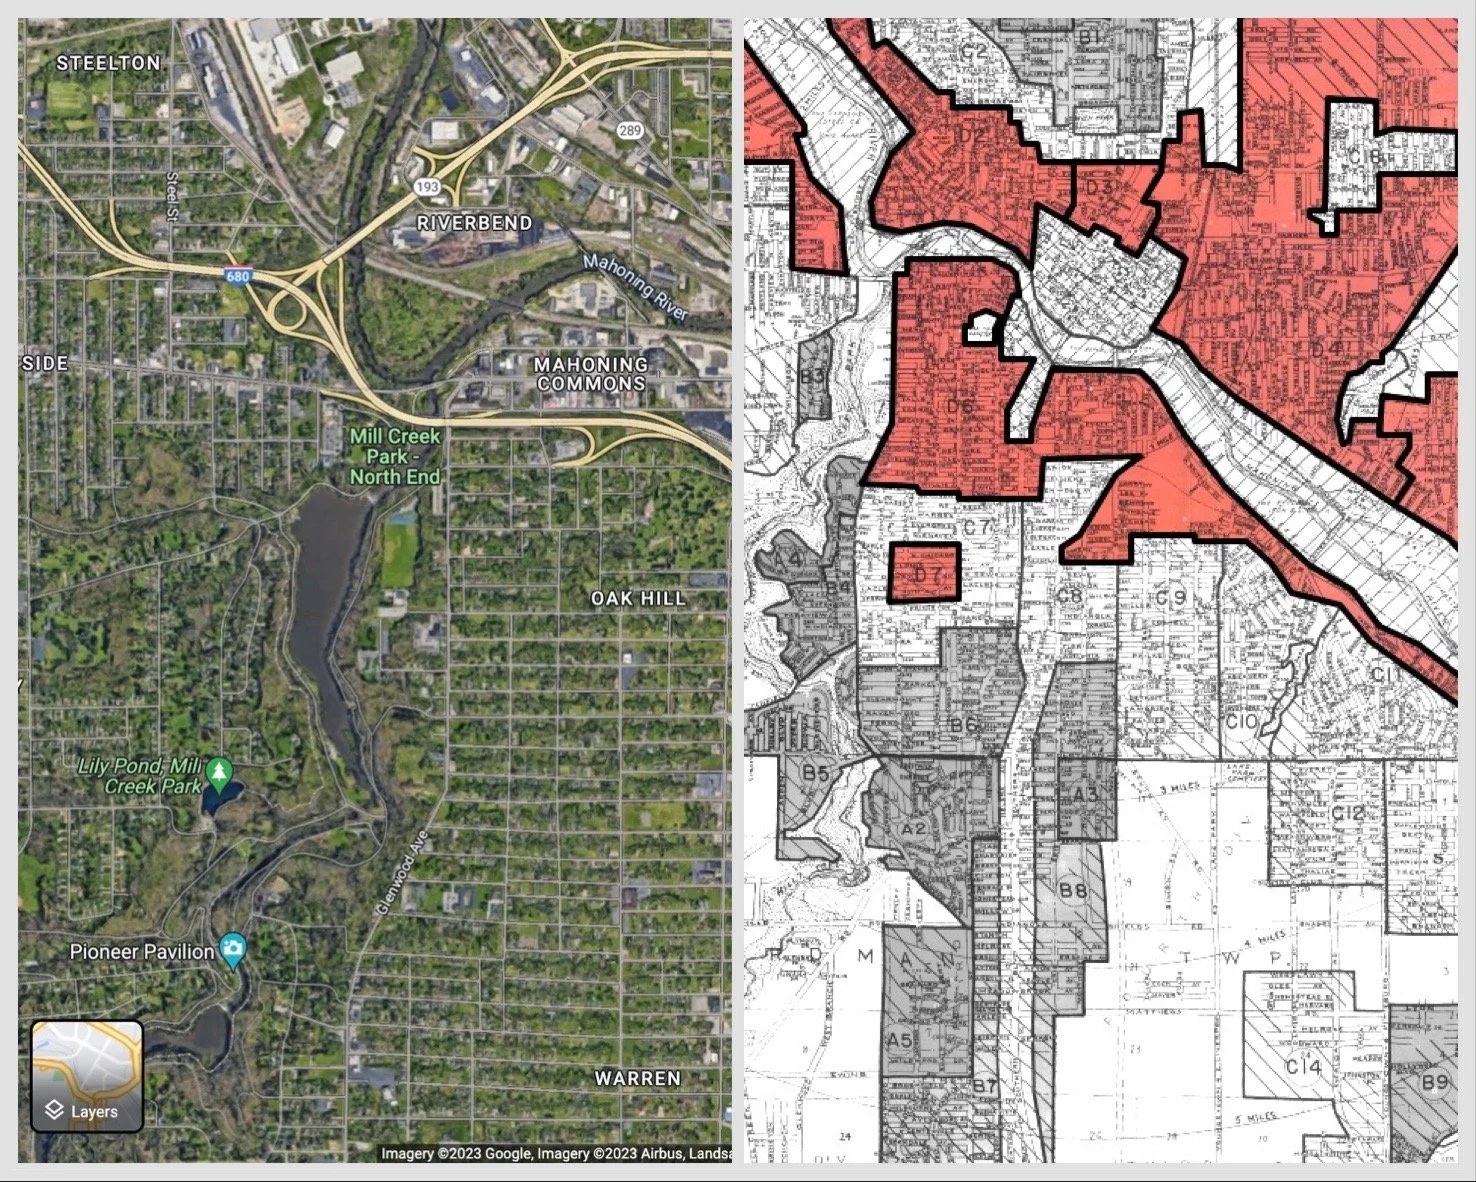
HOLC Map, Youngstown, OH. 1940
Cleveland, Ohio
11% - A, 23% - B, 47% - C, 18% - D
City Pop. 878,336 (1940), 367,991 (2021)
District D-21: "Strong colored infiltration from Outhwaite - Woodland Sec.” "Predominantly Russian Jews - some Hungarians, few Italians” - HOLC ’37
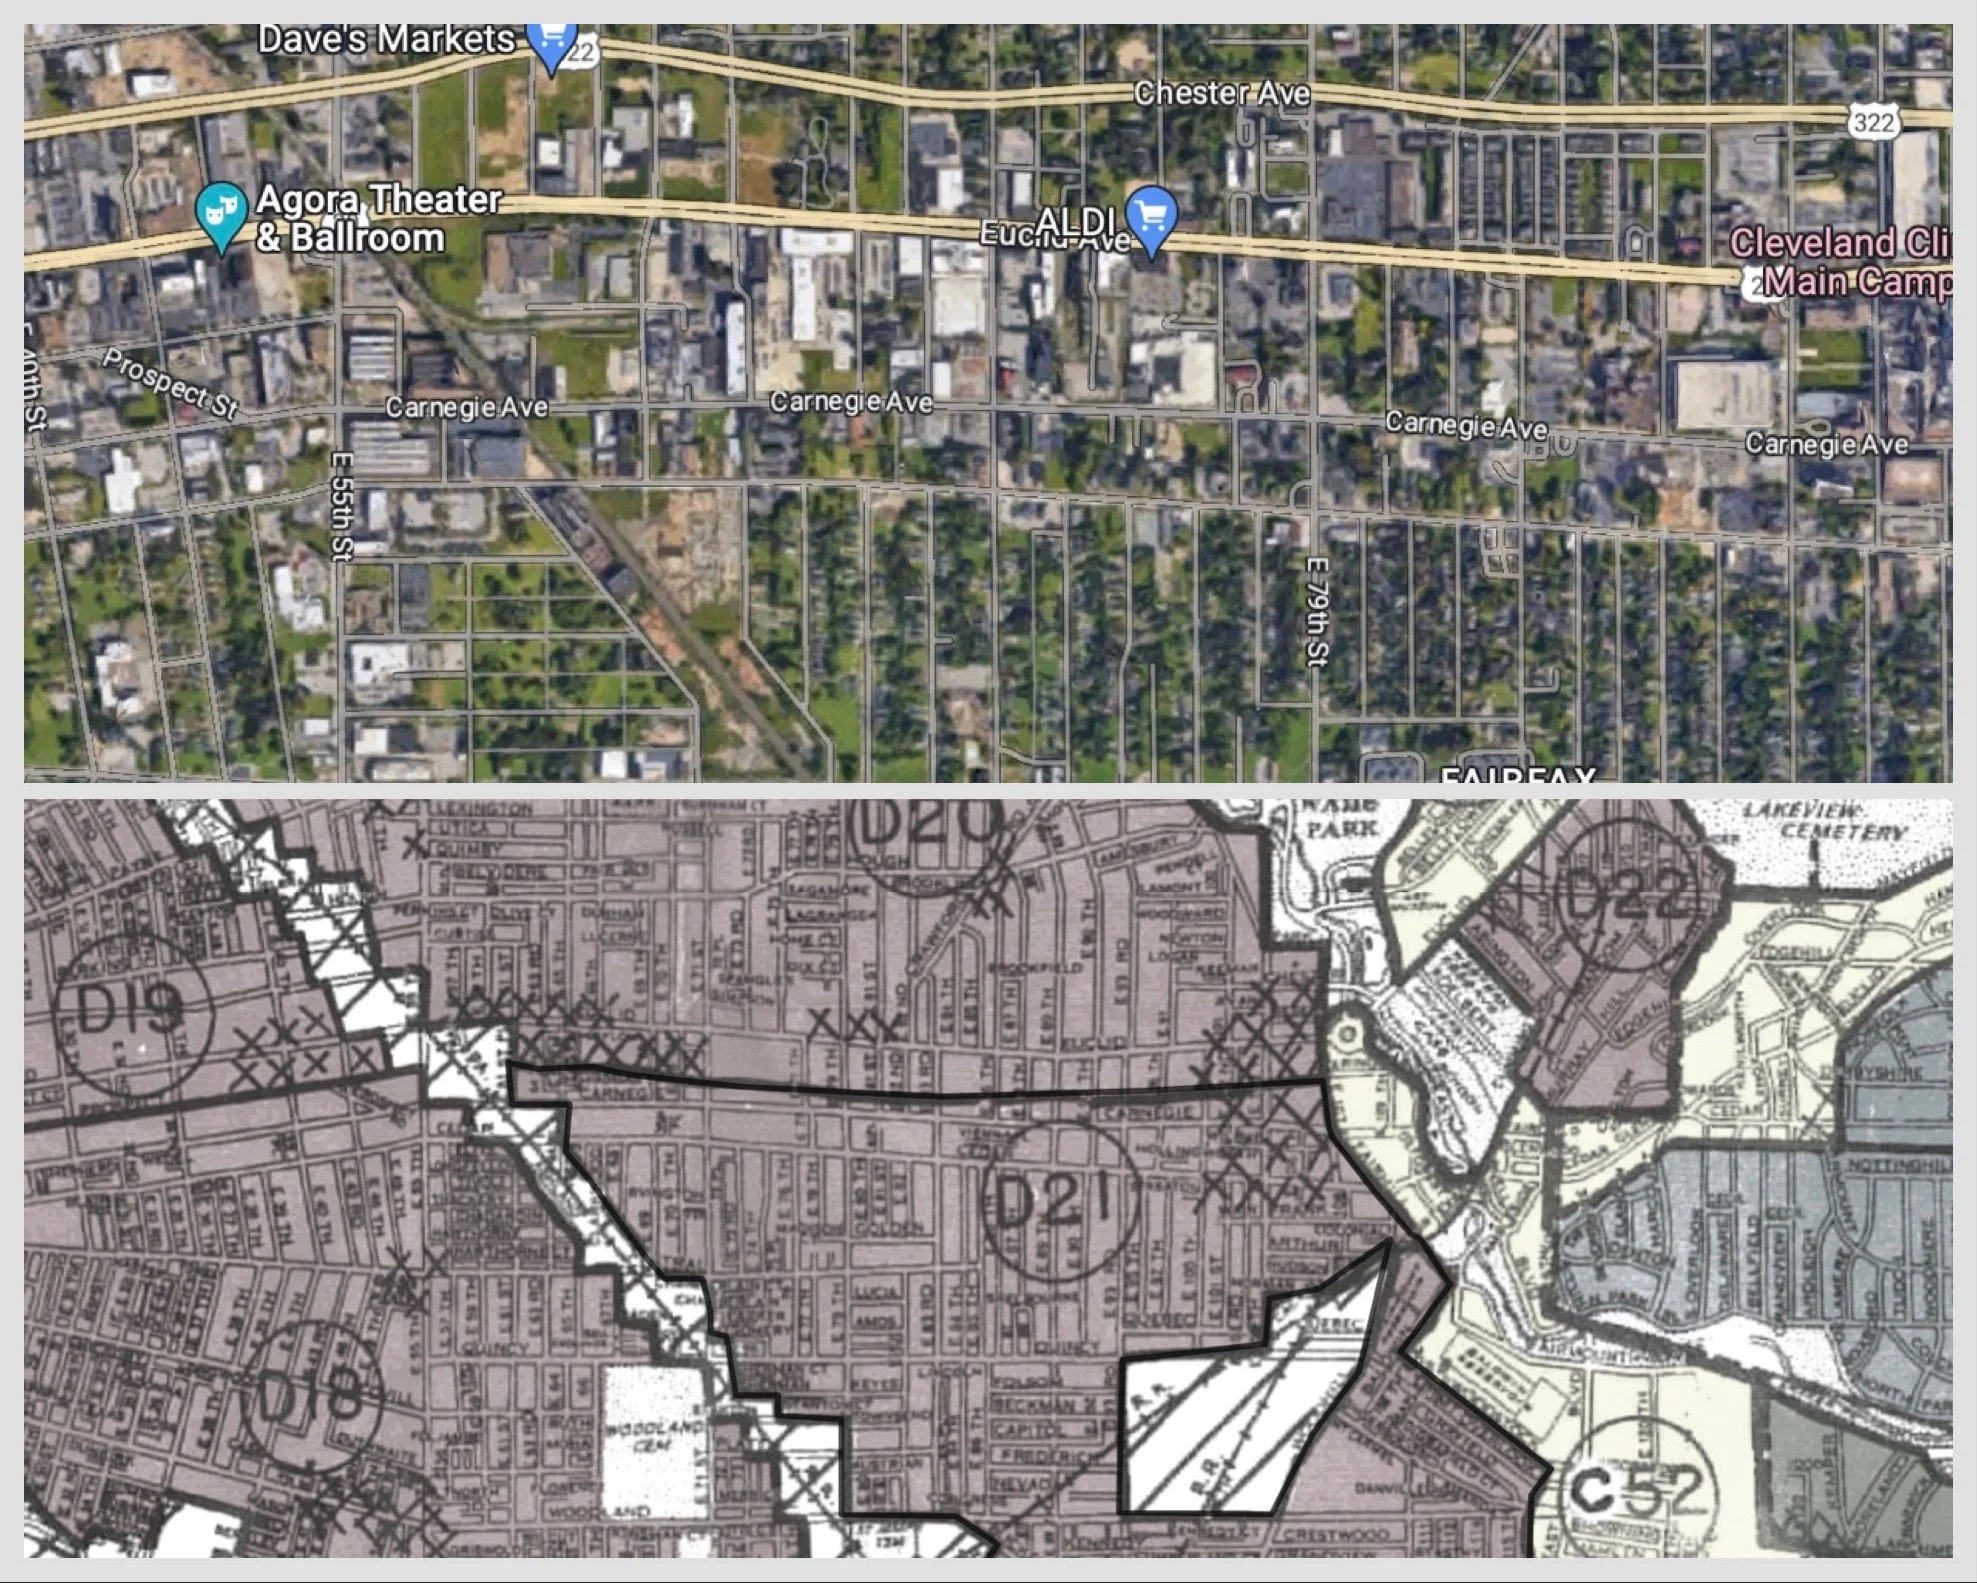
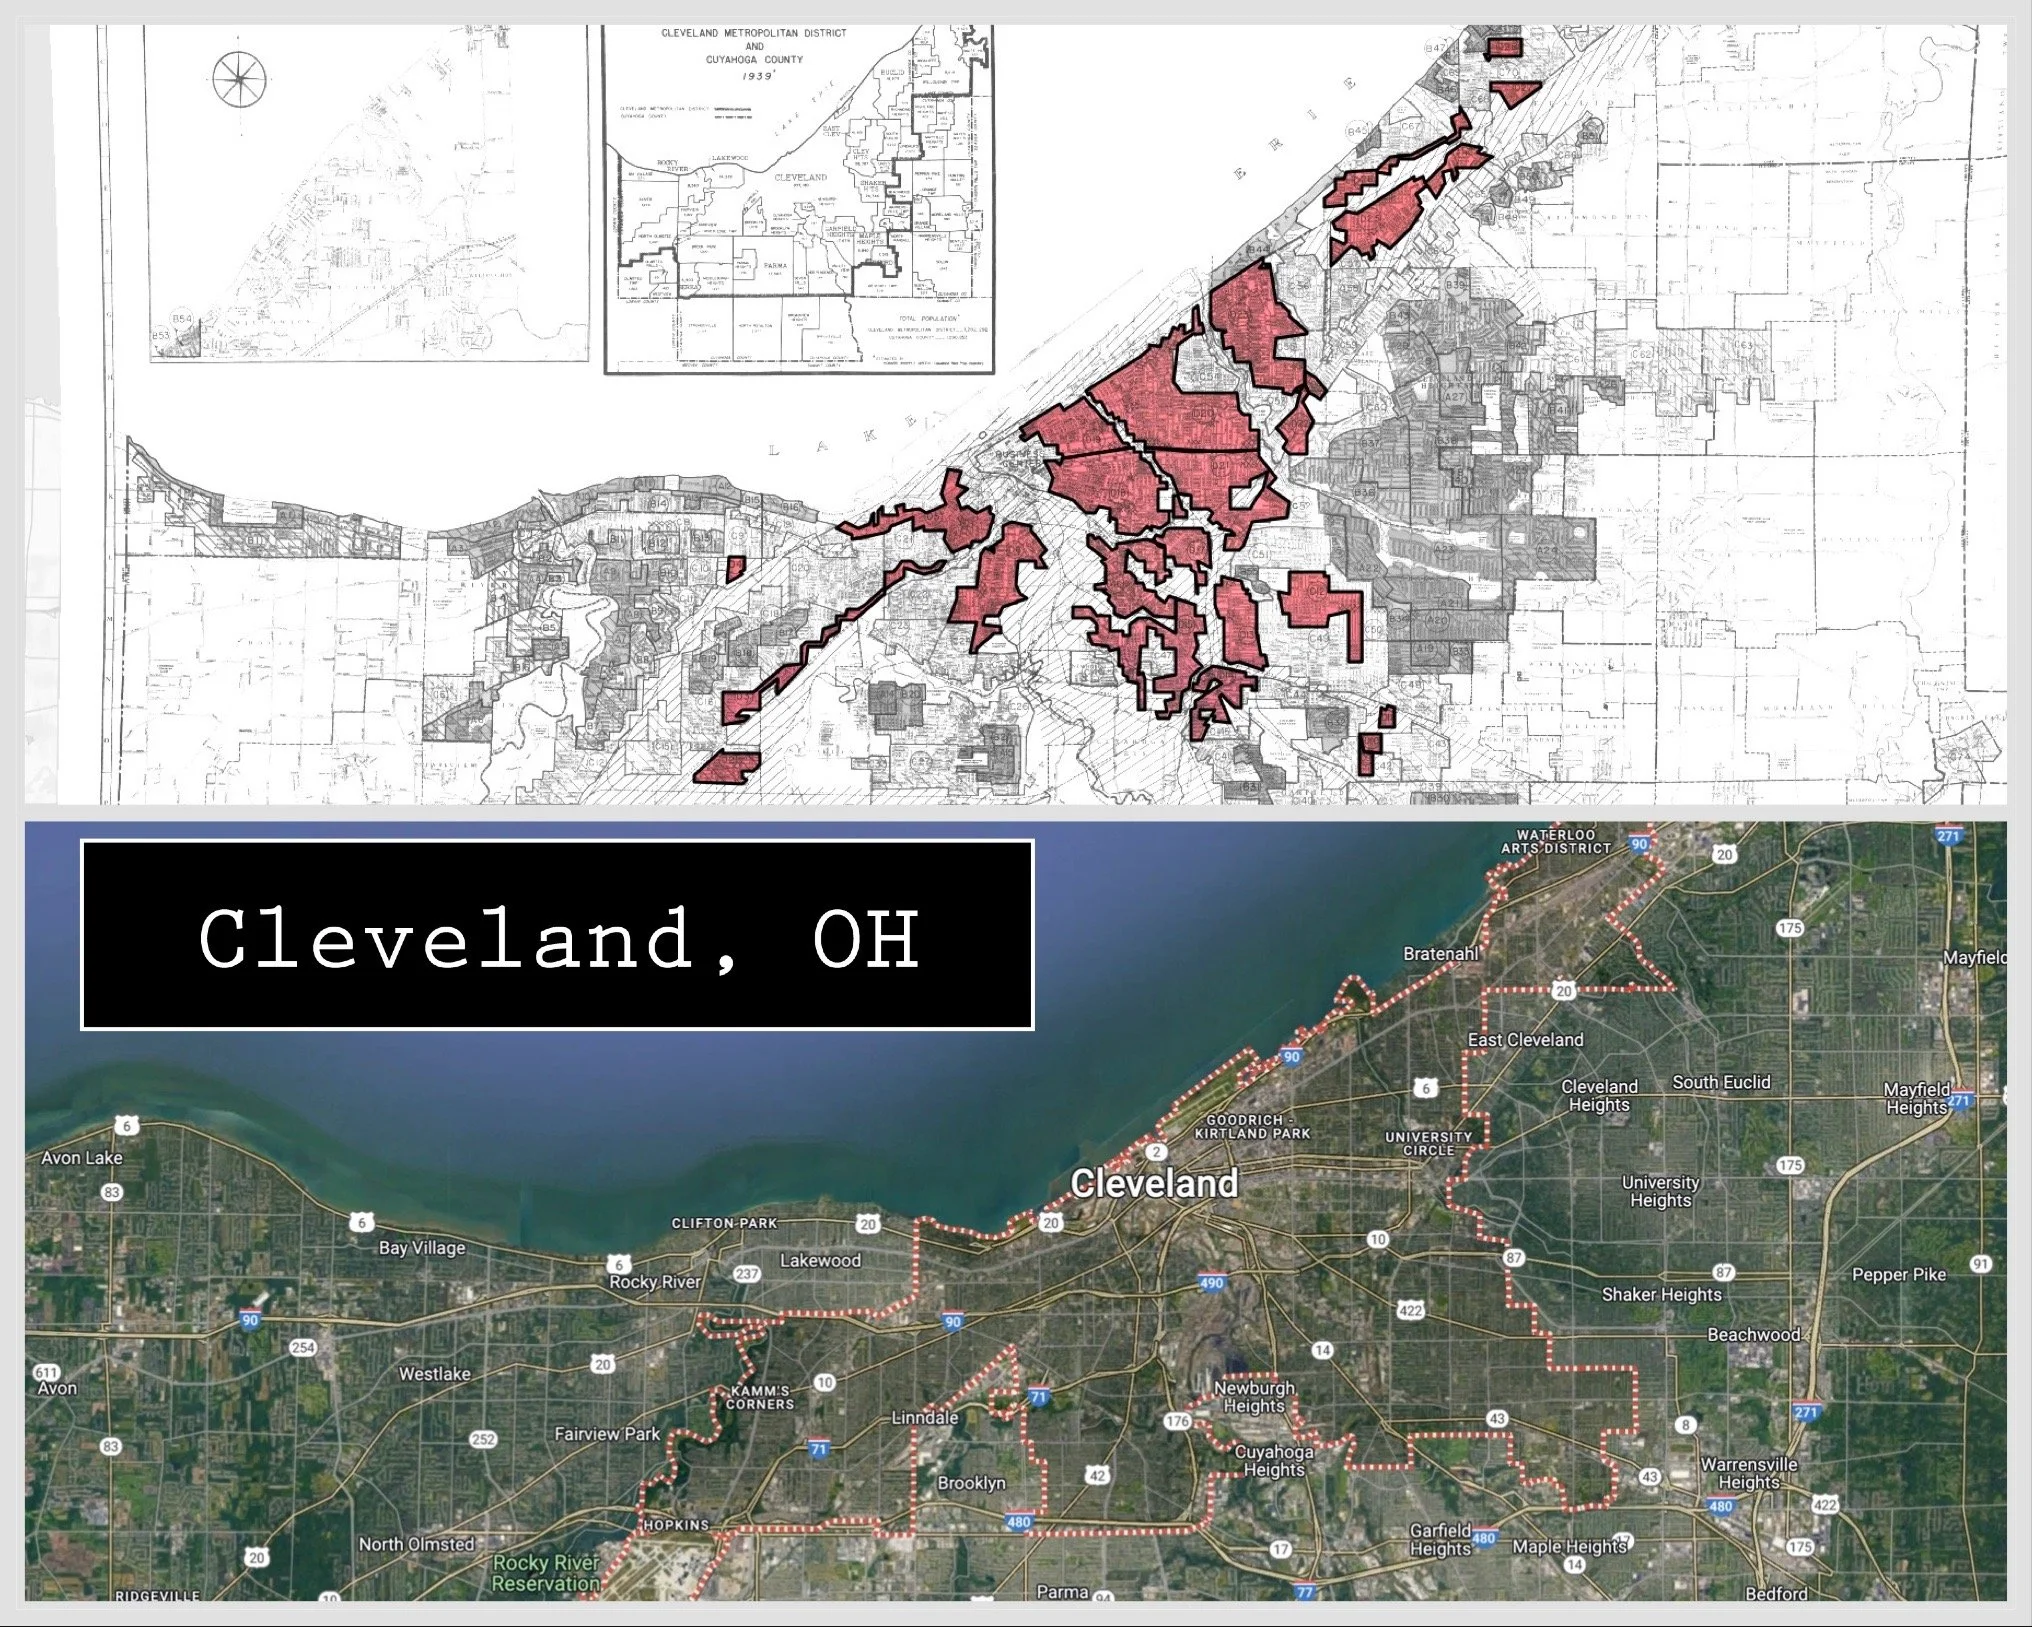
HOLC Map, Cleveland, OH. 1937
Canton, Ohio
7% - A, 38% - B, 39% - C, 17% - D
City Pop. 108,401 (1940), 70,426 (2021)
District D-6: Fairly good section for laboring class. An old American settlement Area is interspersed by small retail business shops. One of the older areas in the city. Values were reported static for past 12 months.” - HOLC

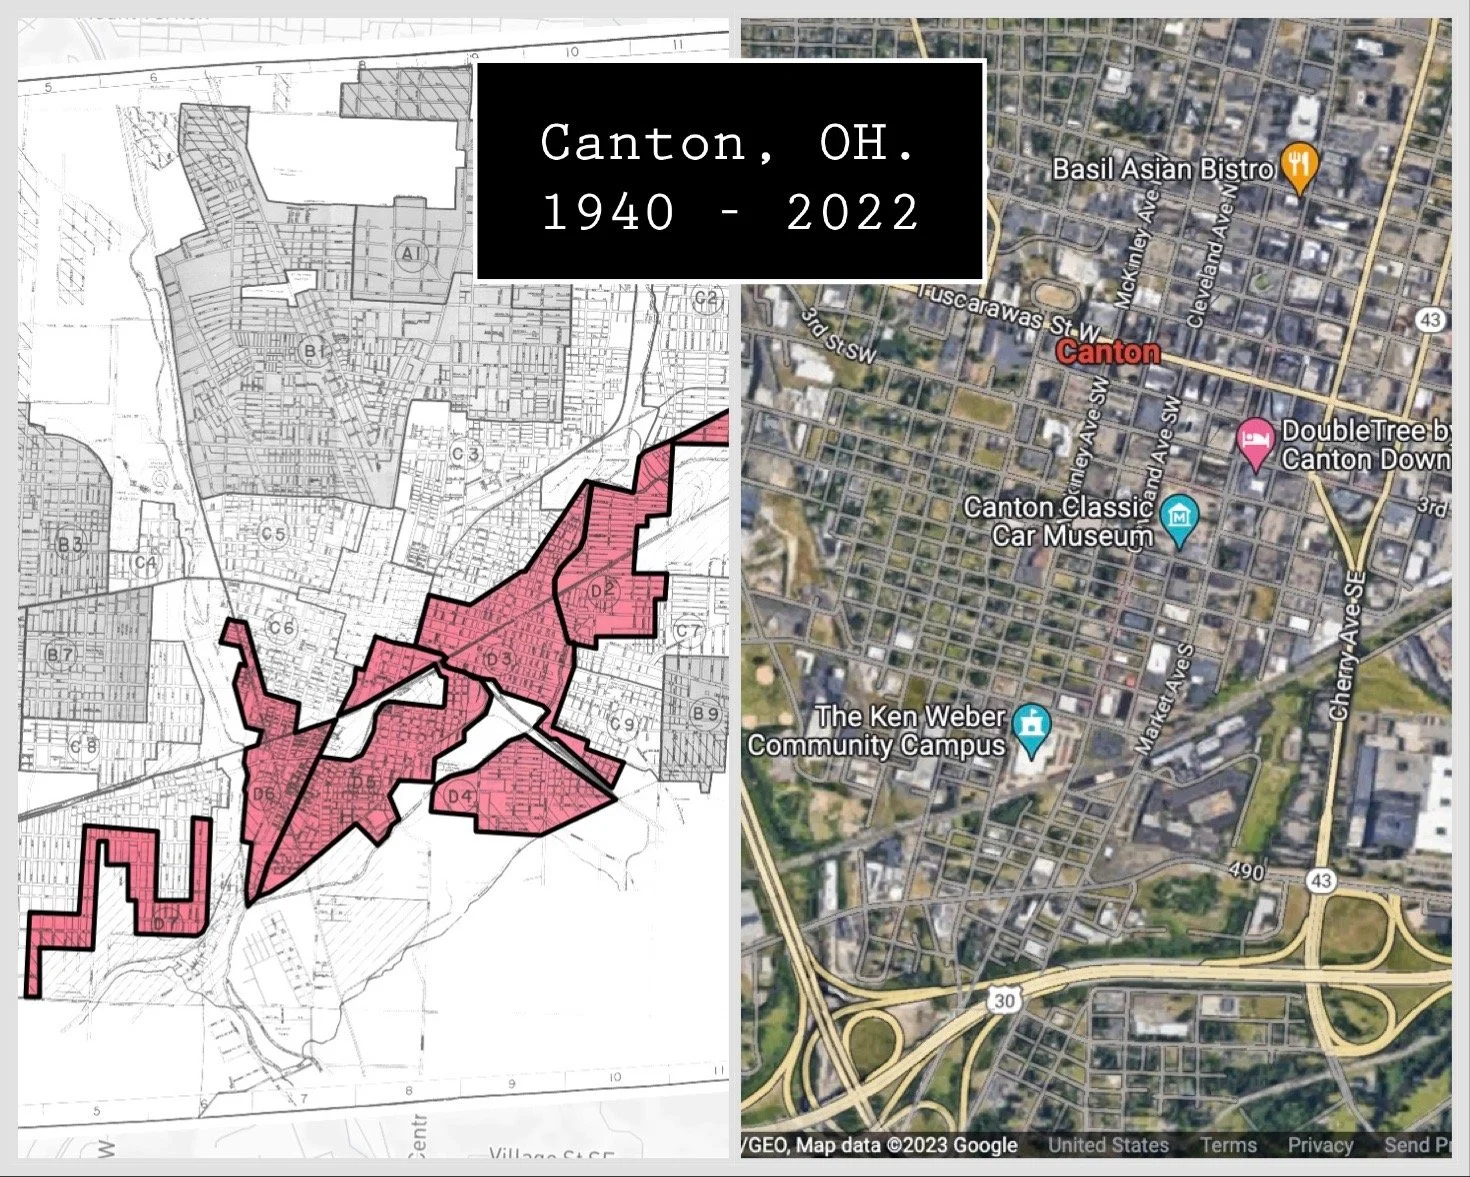
HOLC Map, Canton,. OH
In 1968, The Fair Housing Act was passed, but by then a lot of intercity neighborhoods had interstates plunging through them displacing millions of mostly African-Americans. Americans that should have their neighborhoods thrive and connected. Cities are continuously divided and segregated by the transportations policies choking it, which in turn are being choked by the zoning policies enacted. As stated by the US Government, “The Fair Housing Act protects people from discrimination when they are renting or buying a home, getting a mortgage, seeking housing assistance, or engaging in other housing-related activities. Additional protections apply to federally-assisted housing.” However, policy has not totally fixed the problem per usual. A sort of phantom redlining thrives in the privatization of the residential real estate market. Along with the consolidation of the commercial and rent markets; an effect of artificial inflation can be felt. A product of an unequal, privatized, and disconnected region lead by those who don’t want to address the history or the sustainability.
Though we are far from the days of the HOLC circling maps in red; a ghost of such can still be felt in the economic system we follow.
FIN
Sources //
https://dsl.richmond.edu/panorama/redlining/#loc=10/40.901/-81.527&city=akron-oh
National Community Reinvestment Coalition: HOLC “Redlining” Maps; Bruce Mitchell PhD. & Juan Franco. 2023
North Canton, Ohio Zoning Map, North Canton Policy Office. 8/10/2023
https://www.hud.gov/program_offices/fair_housing_equal_opp/fair_housing_act_overview


